

Factors contributing to speech perception scores in long-term pediatric cochlear implant users
- PMID: 21832887
- PMCID: PMC3187573
- DOI: 10.1097/AUD.0b013e3181ffdb8b
Factors contributing to speech perception scores in long-term pediatric cochlear implant users
Abstract
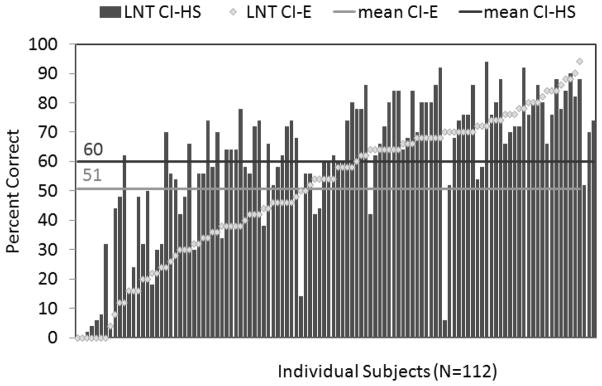
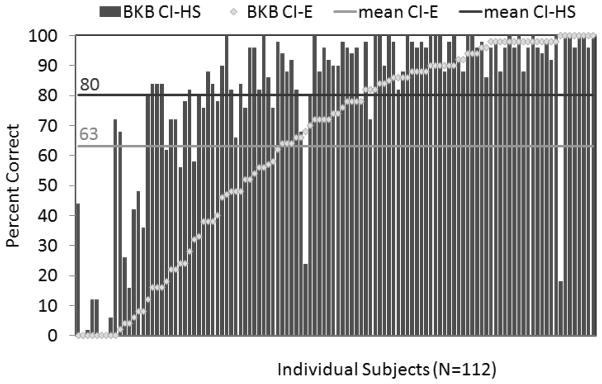
Objectives: The objectives of this report are to (1) describe the speech perception abilities of long-term pediatric cochlear implant (CI) recipients by comparing scores obtained at elementary school (CI-E, 8 to 9 yrs) with scores obtained at high school (CI-HS, 15 to 18 yrs); (2) evaluate speech perception abilities in demanding listening conditions (i.e., noise and lower intensity levels) at adolescence; and (3) examine the relation of speech perception scores to speech and language development over this longitudinal timeframe.
Design: All 112 teenagers were part of a previous nationwide study of 8- and 9-yr-olds (N = 181) who received a CI between 2 and 5 yrs of age. The test battery included (1) the Lexical Neighborhood Test (LNT; hard and easy word lists); (2) the Bamford Kowal Bench sentence test; (3) the Children's Auditory-Visual Enhancement Test; (4) the Test of Auditory Comprehension of Language at CI-E; (5) the Peabody Picture Vocabulary Test at CI-HS; and (6) the McGarr sentences (consonants correct) at CI-E and CI-HS. CI-HS speech perception was measured in both optimal and demanding listening conditions (i.e., background noise and low-intensity level). Speech perception scores were compared based on age at test, lexical difficulty of stimuli, listening environment (optimal and demanding), input mode (visual and auditory-visual), and language age.
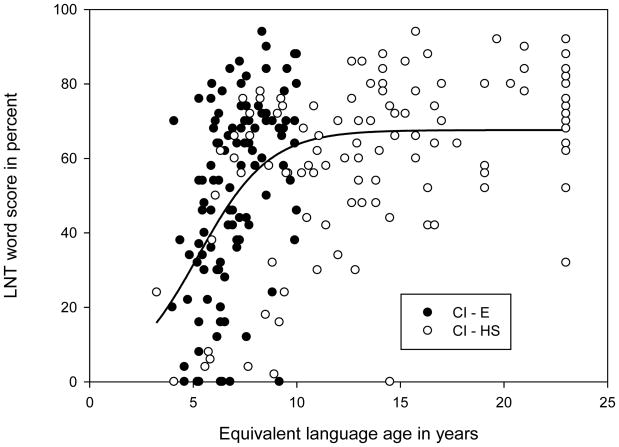
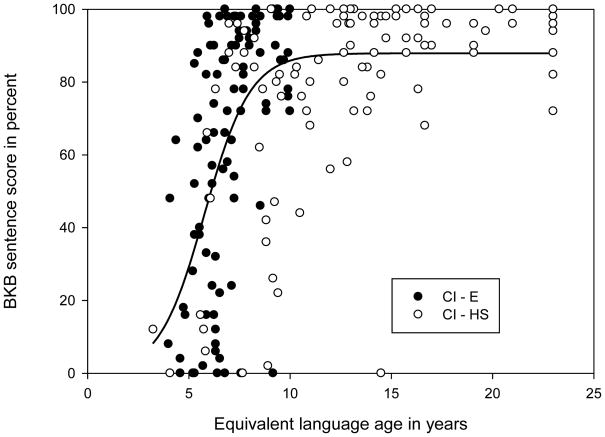
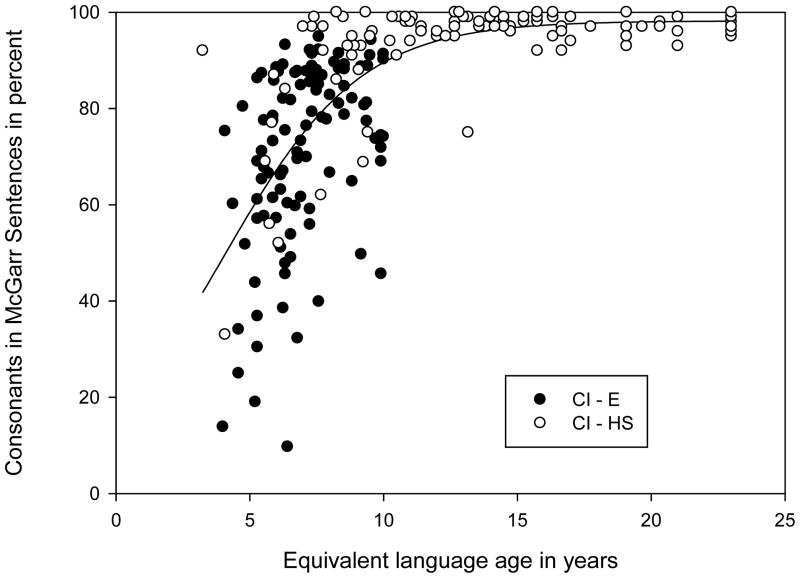
Results: All group mean scores significantly increased with age across the two test sessions. Scores of adolescents significantly decreased in demanding listening conditions. The effect of lexical difficulty on the LNT scores, as evidenced by the difference in performance between easy versus hard lists, increased with age and decreased for adolescents in challenging listening conditions. Calculated curves for percent correct speech perception scores (LNT and Bamford Kowal Bench) and consonants correct on the McGarr sentences plotted against age-equivalent language scores on the Test of Auditory Comprehension of Language and Peabody Picture Vocabulary Test achieved asymptote at similar ages, around 10 to 11 yrs.
Conclusions: On average, children receiving CIs between 2 and 5 yrs of age exhibited significant improvement on tests of speech perception, lipreading, speech production, and language skills measured between primary grades and adolescence. Evidence suggests that improvement in speech perception scores with age reflects increased spoken language level up to a language age of about 10 yrs. Speech perception performance significantly decreased with softer stimulus intensity level and with introduction of background noise. Upgrades to newer speech processing strategies and greater use of frequency-modulated systems may be beneficial for ameliorating performance under these demanding listening conditions.
Figures
References
-
- Bamford J, Wilson I. Methodological considerations and practical aspects of the BKB sentence lists. In: Bench J, Bamford JM, editors. Speech-Hearing Tests and The Spoken Language of Hearing Impaired Children. London: Academic Press; 1979.
-
- Beadle EA, McKinley DJ, Nikolopoulos TP, Brough J, O’Donoghue GM, Archbold SM. Long-term functional outcomes and academic-occupational status in implanted children after 10 to 14 years of cochlear implant use. Otol Neurotol. 2005;26(6):1152–1160. - PubMed
-
- Blamey P, Sarant J. Speech perception and language criteria for paediatric cochlear implant candidature. Audiol Neurootol. 2002;7(2):114–121. - PubMed
-
- Blamey P, Sarant JZ, Paatsch LE, Barry JG, Bow CP, Wales RJ, et al. Relationships among speech perception, production, language, hearing loss, and age in children with impaired hearing. J Speech Lang Hear Res. 2001;44(2):264–285. - PubMed
-
- Carhart R, Jerger J. Preferred method for clinical determination of pure-tone thresholds. Journal of Speech and Hearing Disorders. 1959;24:330–345.
Publication types
MeSH terms
Grants and funding
LinkOut - more resources
Full Text Sources
Medical
