

Ocean time-series reveals recurring seasonal patterns of virioplankton dynamics in the northwestern Sargasso Sea
- PMID: 21833038
- PMCID: PMC3260494
- DOI: 10.1038/ismej.2011.101
Ocean time-series reveals recurring seasonal patterns of virioplankton dynamics in the northwestern Sargasso Sea
Abstract
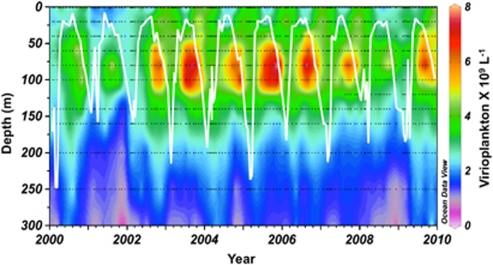
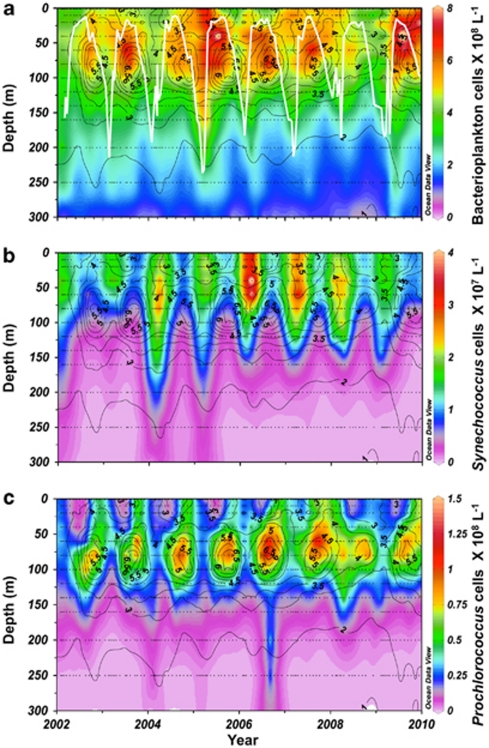
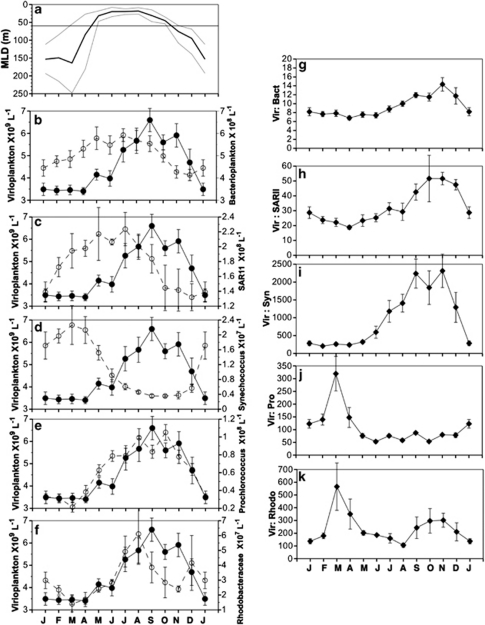
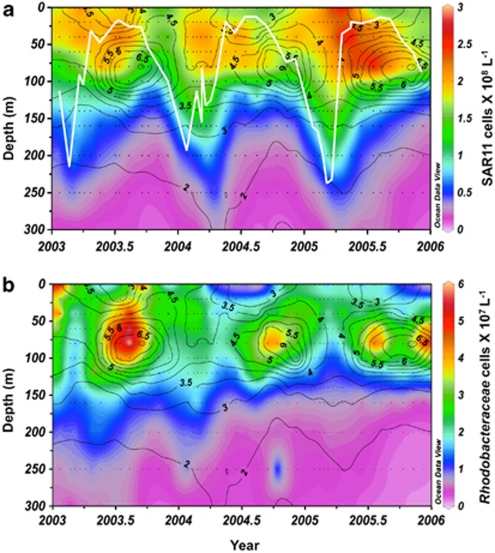
There are an estimated 10(30) virioplankton in the world oceans, the majority of which are phages (viruses that infect bacteria). Marine phages encompass enormous genetic diversity, affect biogeochemical cycling of elements, and partially control aspects of prokaryotic production and diversity. Despite their importance, there is a paucity of data describing virioplankton distributions over time and depth in oceanic systems. A decade of high-resolution time-series data collected from the upper 300 m in the northwestern Sargasso Sea revealed recurring temporal and vertical patterns of virioplankton abundance in unprecedented detail. An annual virioplankton maximum developed between 60 and 100 m during periods of summer stratification and eroded during winter convective mixing. The timing and vertical positioning of this seasonal pattern was related to variability in water column stability and the dynamics of specific picophytoplankton and heterotrophic bacterioplankton lineages. Between 60 and 100 m, virioplankton abundance was negatively correlated to the dominant heterotrophic bacterioplankton lineage SAR11, as well as the less abundant picophytoplankton, Synechococcus. In contrast, virioplankton abundance was positively correlated to the dominant picophytoplankton lineage Prochlorococcus, and the less abundant alpha-proteobacteria, Rhodobacteraceae. Seasonally, virioplankton abundances were highly synchronous with Prochlorococcus distributions and the virioplankton to Prochlorococcus ratio remained remarkably constant during periods of water column stratification. The data suggest that a significant fraction of viruses in the mid-euphotic zone of the subtropical gyres may be cyanophages and patterns in their abundance are largely determined by Prochlorococcus dynamics in response to water column stability. This high-resolution, decadal survey of virioplankton abundance provides insight into the possible controls of virioplankton dynamics in the open ocean.
Figures
References
-
- Alonso C, Pernthaler J. Roseobacter and SAR11 dominate microbial glucose uptake in coastal North Sea waters. Environ Microbiol. 2006;8:2022–2030. - PubMed
-
- Angly F, Youle M, Nostrat B, Srinagesh S, Rodriguez-Brito B, McNairnie P, et al. Genomic analysis of multiple Roseophage SIO1 strains. Environ Microbiol. 2009;11:2863–2873. - PubMed
-
- Bergh, Børsheim KY, Bratbak G, Heldal M. High abundance of viruses found in aquatic environments. Nature. 1989;340:467–468. - PubMed
-
- Boehme J, Frischer ME, Jiang SC, Kellogg CA, Pichard S, Rose JB, et al. Viruses, bacterioplankton, and phytoplankton in the southeastern Gulf of Mexico: distribution and contribution to oceanic DNA pools. Mar Ecol Prog Ser. 1993;97:1–10.
