

Evaluation of optical clearing with the combined liquid paraffin and glycerol mixture
- PMID: 21833369
- PMCID: PMC3149530
- DOI: 10.1364/BOE.2.002329
Evaluation of optical clearing with the combined liquid paraffin and glycerol mixture
Abstract
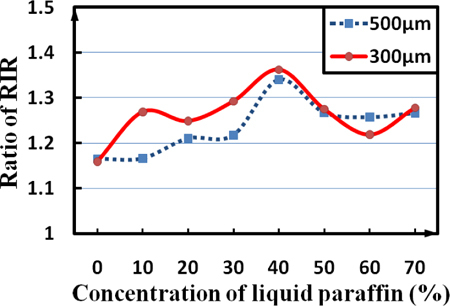
By scanning biological tissues in vivo and in vitro with optical coherence tomography, it is found that liquid paraffin can enhance the percutaneous penetration of glycerol in deep layers of tissue and take synergistically optical clearing effect with glycerol. It is shown from experimental results that 30% - 50% liquid paraffin glycerol solutions have the best enhancement effect. Considering the refractive index of liquid paraffin and its medicinal value, we think liquid paraffin will play an important role in optical clearing as the penetration enhancer of glycerol in future clinical research.
Keywords: (110.0113) Imaging through turbid media; (170.3880) Medical and biological imaging; (170.4500) Optical coherence tomography; (170.6930) Tissue.
Figures


Similar articles
-
Optical clearing for luminal organ imaging with ultrahigh-resolution optical coherence tomography.J Biomed Opt. 2016 Aug;21(8):081211. doi: 10.1117/1.JBO.21.8.081211. J Biomed Opt. 2016. PMID: 27335154 Free PMC article.
-
Study on reflection of human skin with liquid paraffin as the penetration enhancer by spectroscopy.J Biomed Opt. 2013 Oct;18(10):105001. doi: 10.1117/1.JBO.18.10.105001. J Biomed Opt. 2013. PMID: 24091625
-
Study on application of optical clearing technique in skin diseases.J Biomed Opt. 2012 Nov;17(11):115003. doi: 10.1117/1.JBO.17.11.115003. J Biomed Opt. 2012. PMID: 23143160
-
Recent progress in tissue optical clearing for spectroscopic application.Spectrochim Acta A Mol Biomol Spectrosc. 2018 May 15;197:216-229. doi: 10.1016/j.saa.2018.01.085. Epub 2018 Feb 3. Spectrochim Acta A Mol Biomol Spectrosc. 2018. PMID: 29433855 Review.
-
Measurement of tissue optical properties in the context of tissue optical clearing.J Biomed Opt. 2018 Aug;23(9):1-31. doi: 10.1117/1.JBO.23.9.091416. J Biomed Opt. 2018. PMID: 30141286 Review.
Cited by
-
Optical clearing of archive-compatible paraffin embedded tissue for multiphoton microscopy.Biomed Opt Express. 2012 Nov 1;3(11):2752-60. doi: 10.1364/BOE.3.002752. Epub 2012 Oct 3. Biomed Opt Express. 2012. PMID: 23162713 Free PMC article.
-
Optical clearing for luminal organ imaging with ultrahigh-resolution optical coherence tomography.J Biomed Opt. 2016 Aug;21(8):081211. doi: 10.1117/1.JBO.21.8.081211. J Biomed Opt. 2016. PMID: 27335154 Free PMC article.
-
Signal and depth enhancement for in vivo flow cytometer measurement of ear skin by optical clearing agents.Biomed Opt Express. 2013 Oct 17;4(11):2518-26. doi: 10.1364/BOE.4.002518. eCollection 2013. Biomed Opt Express. 2013. PMID: 24298412 Free PMC article.
-
Hyperspectral terahertz imaging and optical clearance for cancer classification in breast tumor surgical specimen.J Med Imaging (Bellingham). 2022 Jan;9(1):014002. doi: 10.1117/1.JMI.9.1.014002. Epub 2022 Jan 12. J Med Imaging (Bellingham). 2022. PMID: 35036473 Free PMC article.
References
-
- R. K. Wang and V. V. Tuchin, “Optical tissue clearing to enhance imaging performance for OCT,” in Optical Coherence Tomography: Technology and Applications, W. Drexler and J. G. Fujimoto, eds., (Springer, 2008).
-
- Tuchin V. V., “Optical clearing of tissues and blood using the immersion method,” J. Phys. D Appl. Phys. 38(15), 2497–2518 (2005).10.1088/0022-3727/38/15/001 - DOI
-
- L. V. Wang and H. Wu, in Biomedical Optics: Principles and Imaging (John Wiley & Sons, Inc., 2007), Chap. 2 & Chap. 5.
-
- V. V. Tuchin, Tissue Optics: Light Scattering Methods and Instruments for Medical Diagnosis, 2nd ed. (SPIE, 2007), Chap. 1.
LinkOut - more resources
Full Text Sources