. 2011 Aug 1;2(8):2403-16.
doi: 10.1364/BOE.2.002403. Epub 2011 Jul 27.

Automated 3-D method for the correction of axial artifacts in spectral-domain optical coherence tomography images

Automated 3-D method for the correction of axial artifacts in spectral-domain optical coherence tomography images

Bhavna Antony et al. Biomed Opt Express. .

Abstract

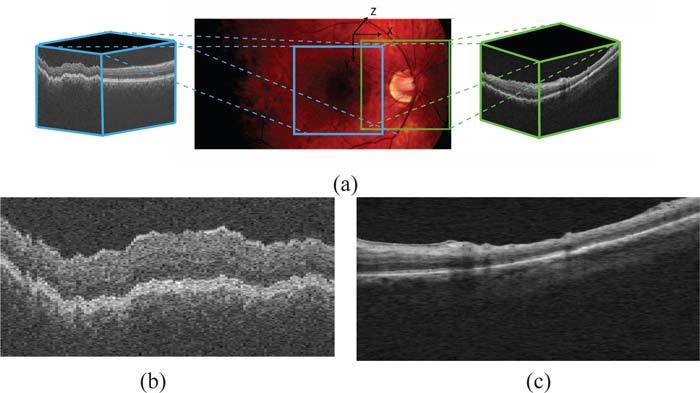
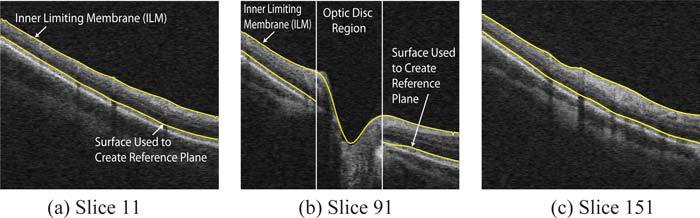
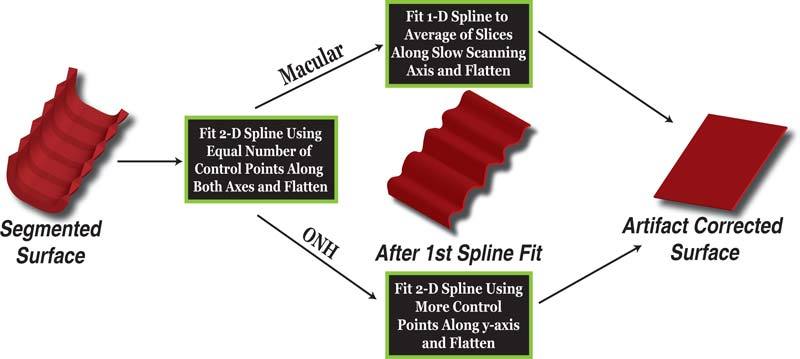
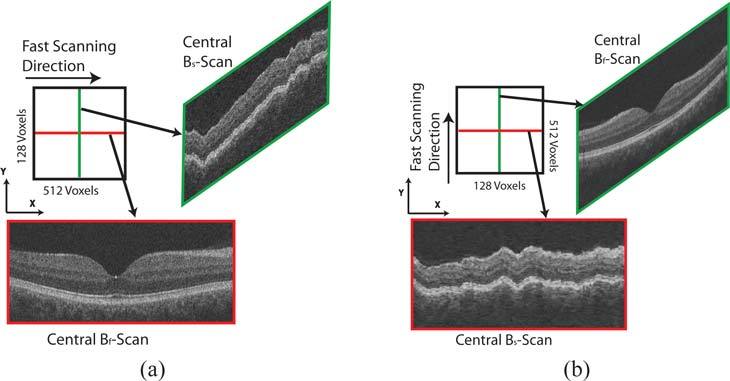
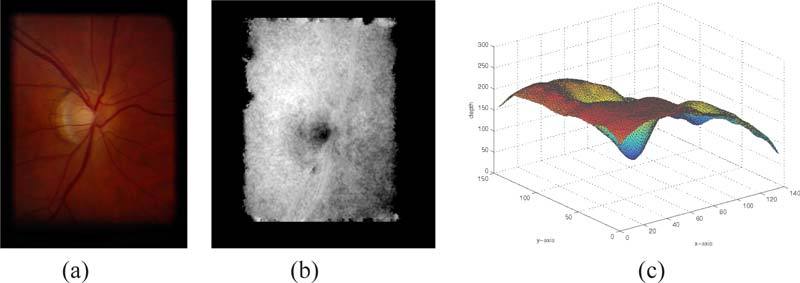
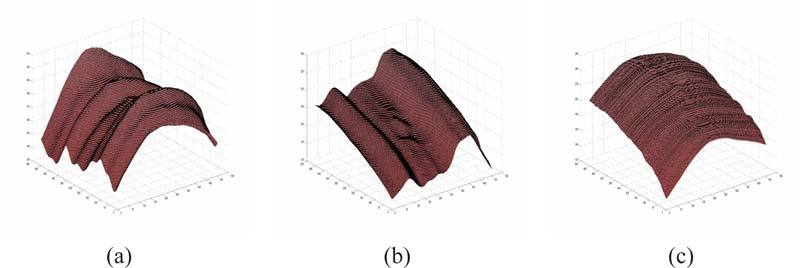
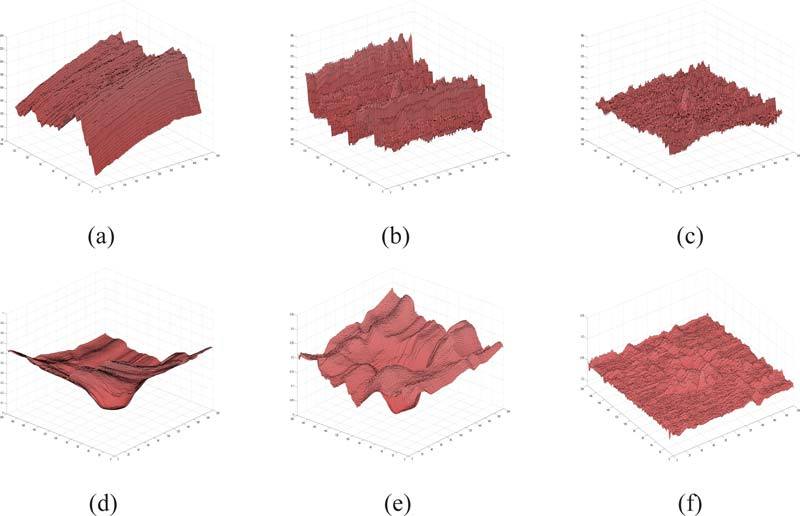
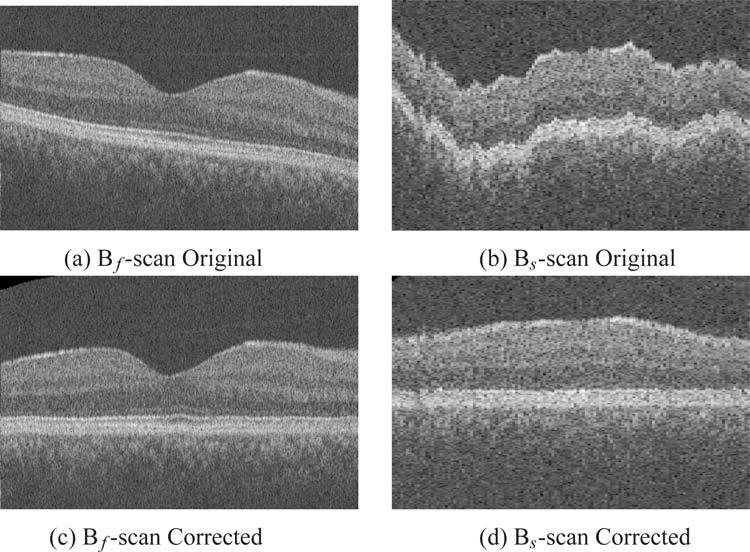
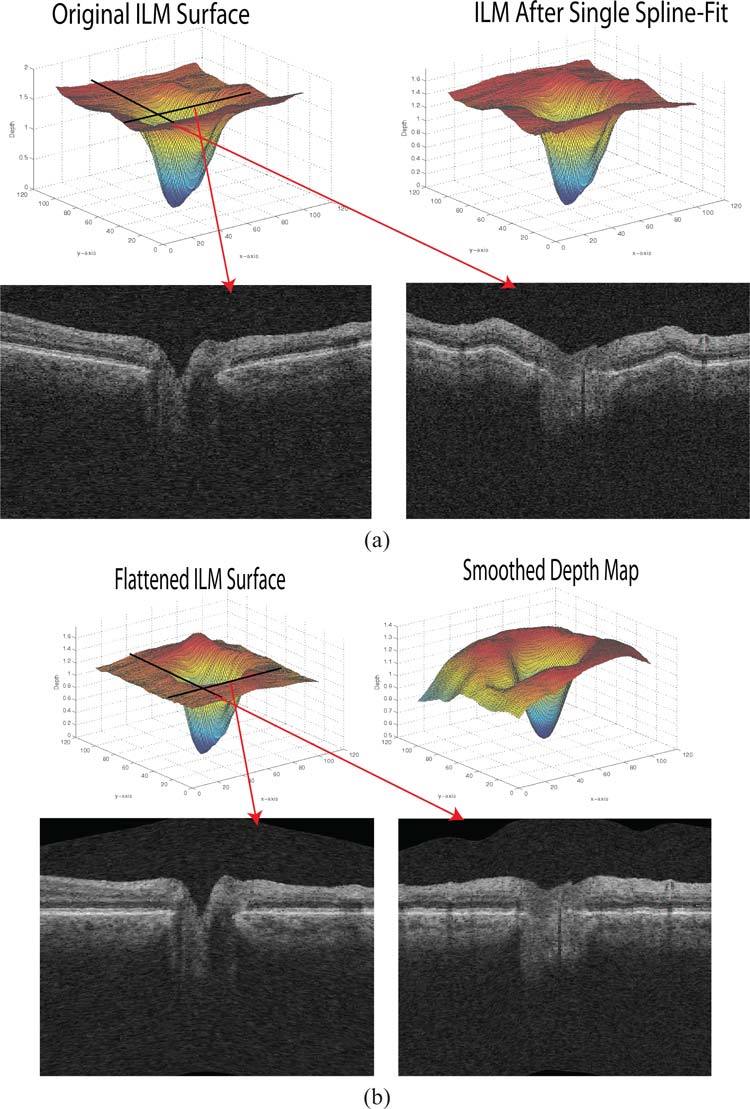
The 3-D spectral-domain optical coherence tomography (SD-OCT) images of the retina often do not reflect the true shape of the retina and are distorted differently along the x and y axes. In this paper, we propose a novel technique that uses thin-plate splines in two stages to estimate and correct the distinct axial artifacts in SD-OCT images. The method was quantitatively validated using nine pairs of OCT scans obtained with orthogonal fast-scanning axes, where a segmented surface was compared after both datasets had been corrected. The mean unsigned difference computed between the locations of this artifact-corrected surface after the single-spline and dual-spline correction was 23.36 ± 4.04 μm and 5.94 ± 1.09 μm, respectively, and showed a significant difference (p < 0.001 from two-tailed paired t-test). The method was also validated using depth maps constructed from stereo fundus photographs of the optic nerve head, which were compared to the flattened top surface from the OCT datasets. Significant differences (p < 0.001) were noted between the artifact-corrected datasets and the original datasets, where the mean unsigned differences computed over 30 optic-nerve-head-centered scans (in normalized units) were 0.134 ± 0.035 and 0.302 ± 0.134, respectively.

Keywords: (100.0100) Image processing; (100.6890) Three-dimensional image processing; (110.4500) Optical coherence tomography.


Figures

Fig. 1
Fig. 1
(a) Fundus photograph depicting the regions scanned in macula-centered and ONH-centered OCT images. (b) A typical central Bs-Scan from a macula-centered image showing artifacts characteristic to yz-slices. (c) A typical central Bf-scan (xz-slice) from an unprocessed ONH-centered volume, showing the tilt artifact commonly seen in these slices.
Fig. 2
Fig. 2
Selected slices from an OCT dataset showing the two surfaces segmented in the original volume. The reference plane is created by fitting a spline in two stages to the lower surface. The inner limiting membrane (ILM) as well as the lower surface are used in validation processes.
Fig. 3
Fig. 3
Overview of method to determine flattening plane. The flattening plane is determined by fitting a spline to a surface twice, to eliminate the two distinct artifacts seen in these images.
Fig. 4
Fig. 4
Schematics showing acquisition of OCT datasets with orthogonal fast scanning axes from the same patient. (a) Central Bf-scan and Bs-scan from an OCT image with horizontal fast-scanning axis. (b) Central Bf-scan and Bs-scan from an OCT image acquired from the same eye with vertical fast-scanning axis. Note that the Bf-scan from the first dataset comes from the same location as the Bs-scan from the second dataset.
Fig. 5
Fig. 5
Fundus photograph and its corresponding disparity maps. (a) One of a pair of stero fundus photographs of a glaucomatous eye. (b) The disparity map constructed from the stereo fundus photographs. (c) The smoothed disparity map in 3-D showing the overall shape of the opic nerve head.
Fig. 6
Fig. 6
Estimating the shape of the eye from paired OCT datasets with orthogonal fast scanning axes. The isotropic surfaces obtained by fitting a thin-plate spline to a segmented surface from (a) the dataset with the horizontal fast scanning axes, and (b) the dataset with the vertical fast scanning axes. (c) The estimate of the “true” curvature of the retina.
Fig. 7
Fig. 7
Examples of the surface used to create the reference plane. (a), (b) and (c) show the segmented surfaces from a macula-centered OCT dataset in the original, partially corrected and final artifact-corrected image, respectively. (d), (e) and (f) show the segmented surface from an ONH centered OCT dataset in the original, partially corrected and final artifact-corrected image, respectively.
Fig. 8
Fig. 8
Central Bf-Scan and Bs-scan slices from an OCT dataset before and after flattening. Original (a) Bf-Scan and, (b) Bs-Scan before artifact correction, respectively. Artifact corrected (c) Bf-Scan and (d) Bs-Scan, respectively.
Fig. 9
Fig. 9
An ONH-centered dataset before and after the axial artifact correction. (a) The ILM in the original dataset and after the first spline fit. Bf-scan and Bs-scan from the original dataset from the locations as indicated by arrows in red. (b) The ILM in the flattened artifact corrected dataset with the same Bf-scan and Bs-scans from the flattened dataset. Smoothed depth image also included.

References

    1. Huang D., Swanson E. A., Lin C. P., Schuman J. S., Stinson W. G., Chang W., Hee M. R., Flotte T., Gregory K., Puliafito C. A., “Optical coherence tomography,” Science 254, 1178–1181 (1991). 10.1126/science.1957169 - DOI - PMC - PubMed
    1. Wojtkowski M., Srinivasan V., Fujimoto J. G., Ko T., Schuman J. S., Kowalczyk A., Duker J. S., “Three dimensional retinal imaging with high-speed ultrahigh-resolution optical coherence tomography,” Ophthalmology 112, 1734–1746 (2005). 10.1016/j.ophtha.2005.05.023 - DOI - PMC - PubMed
    1. Garvin M. K., Abràmoff M. D., Wu X., Russell S. R., Burns T. L., Sonka M., “Automated 3-D intraretinal layer segmentation of macular spectral-domain optical coherence tomography images,” IEEE Trans. Med. Imaging 28, 1436–1447 (2009). 10.1109/TMI.2009.2016958 - DOI - PMC - PubMed
    1. Kajić V., Považay B., Hermann B., Hofer B., Marshall D., Rosin P., P., Drexler W., “Robust segmentation of intraretinal layers in the normal human fovea using a novel statistical model based on texture and shape analysis,” Opt. Express 20, 4730–14744 (2010). - PubMed
    1. Niemeijer M., Garvin M. K., Lee K., van Ginneken B., Abràmoff M. D., Sonka M., “Registration of 3D spectral OCT volumes using 3D SIFT feature point matching,” Proc. SPIE 7259, 72591I (2009). 10.1117/12.811906 - DOI

LinkOut - more resources