. 2012 Aug;49(4):277-89.
doi: 10.1007/s00592-011-0314-9. Epub 2011 Aug 11.

Molecular mechanisms of muscarinic acetylcholine receptor-stimulated increase in cytosolic free Ca(2+) concentration and ERK1/2 activation in the MIN6 pancreatic β-cell line

Affiliations

Molecular mechanisms of muscarinic acetylcholine receptor-stimulated increase in cytosolic free Ca(2+) concentration and ERK1/2 activation in the MIN6 pancreatic β-cell line

Joanne L Selway et al. Acta Diabetol. 2012 Aug.

Abstract

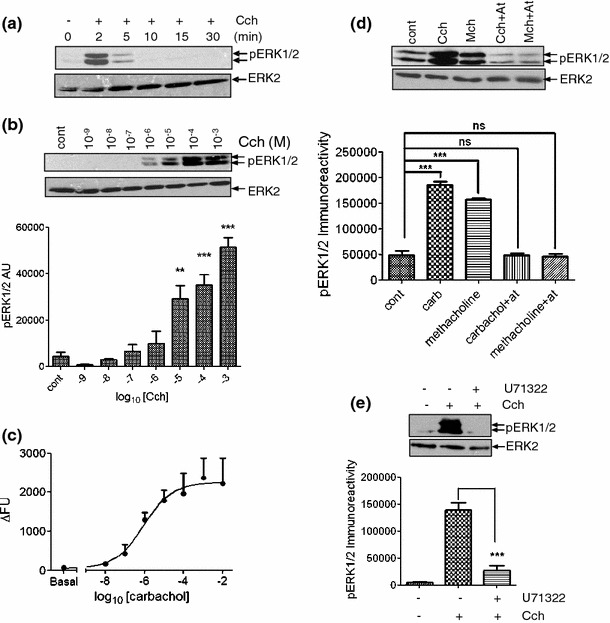
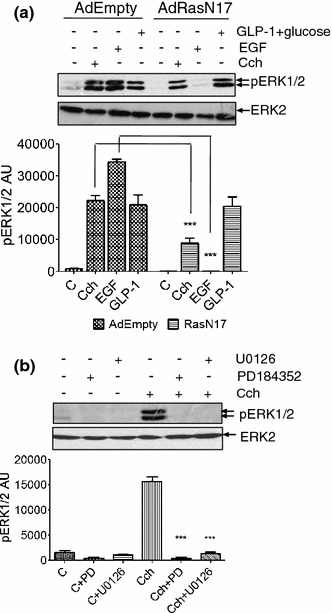
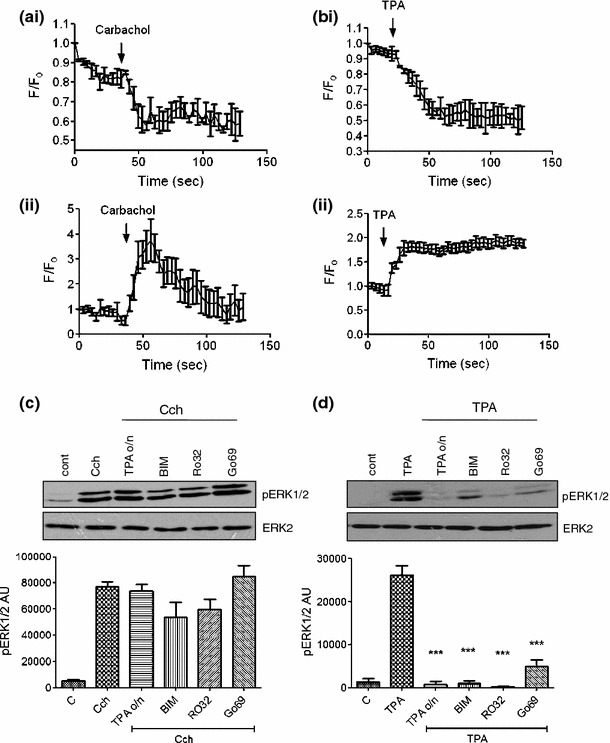
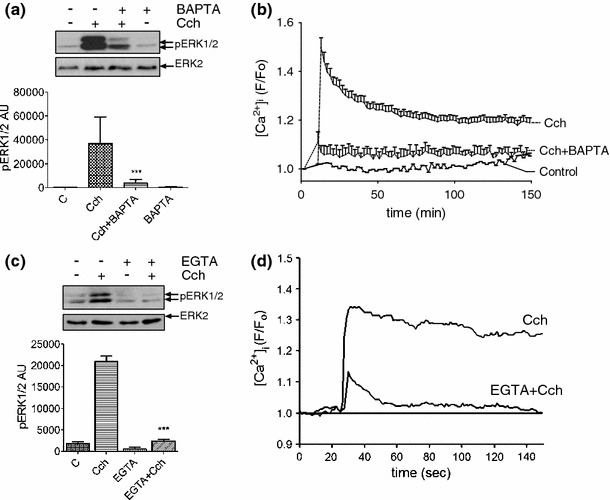
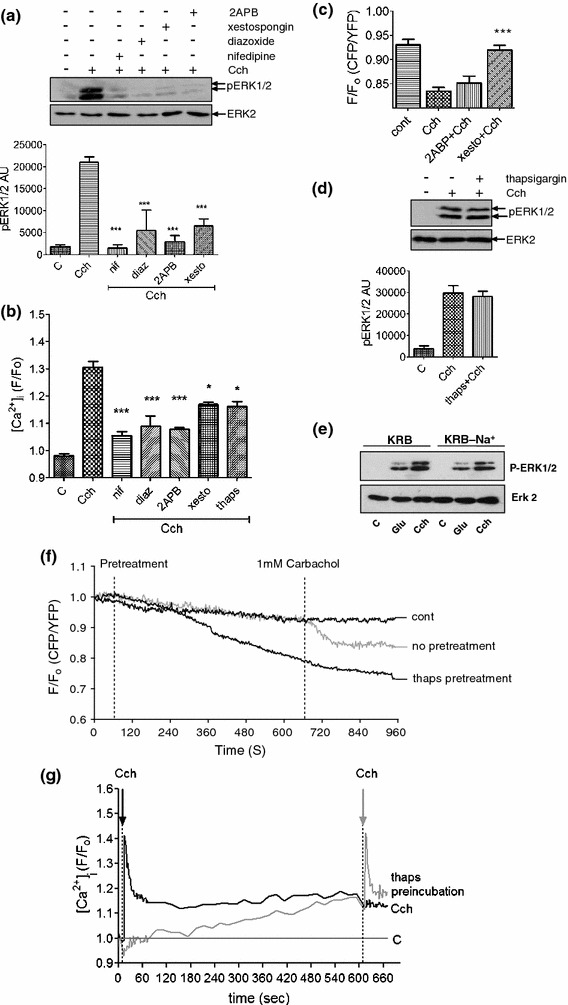
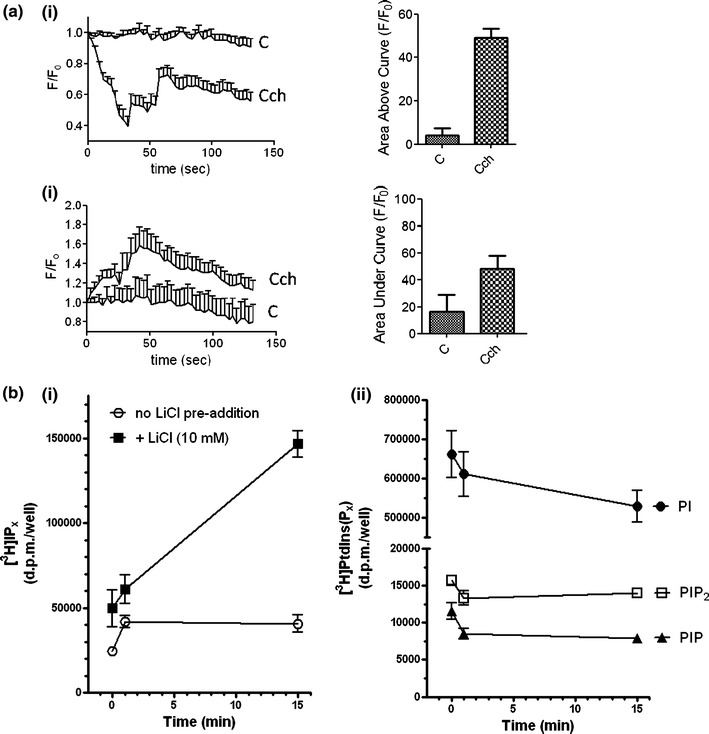
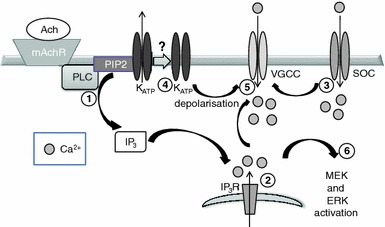
Muscarinic acetylcholine receptor (mAChR) activation of pancreatic β-cells elevates intracellular Ca(2+) and potentiates glucose-stimulated insulin secretion. In addition, it activates a number of signaling molecules, including ERK1/2, whose activation has been shown to play an important role in regulating pancreatic β-cell function and mass. The aim of this work was to determine how mAChR activation elevates intracellular Ca(2+) concentration ([Ca(2+)]( i )) and activates ERK1/2 in the pancreatic β-cell line MIN6. We demonstrate that agonist-stimulated ERK1/2 activation is dependent on the activation of phospholipase C and an elevation in [Ca(2+)]( i ), but is independent of the activation of diacylglycerol-dependent protein kinase C isoenzymes. Using a pharmacological approach, we provide evidence that agonist-induced increases in [Ca(2+)]( i ) and ERK activity require (1) IP(3) receptor-mediated mobilization of Ca(2+) from the endoplasmic reticulum, (2) influx of extracellular Ca(2+) through store-operated channels, (3) closure of K(ATP) channels, and (4) Ca(2+) entry via L-type voltage-operated Ca(2+) channels. Moreover, this Ca(2+)-dependent activation of ERK is mediated via both Ras-dependent and Ras-independent mechanisms. In summary, this study provides important insights into the multifactorial signaling mechanisms linking mAChR activation to increases in [Ca(2+)]( i ) and ERK activity.


Figures

Fig. 1
Fig. 1
Characterization of carbachol-stimulated increase in [Ca2+]i and ERK1/2 activation. MIN6 cells pre-incubated for 1 h with KRB-minus-glucose; a Carbachol (1 mM) for the times indicated; b carbachol at the concentrations indicated for 2 min. Proteins were separated by SDS–PAGE and detected by Western blotting using anti-phospho-ERK1/2 and anti-ERK2 antibodies. Data shown in lower panel are means + SEM (n = 3). **P < 0.01, ***P < 0.001; one-way ANOVA followed by Dunnett’s range test comparing to no carbachol addition. c Concentration–response curve for carbachol-stimulated increases in [Ca2+]i determined in cell populations using a NOVOstar plate reader. Data represent means SEM (n = 3) of the peak change in fluorescence (∆FU) correlating with peak increases in [Ca2+]i. d Where indicated, cells were incubated with atropine (At, 10 μM) for 30 min prior to treatment with carbachol (Cch, 1 mM) or methacholine (Mch, 1 mM) for 2 min. Proteins were separated by SDS–PAGE and detected by Western blotting using anti-phospho-ERK1/2 and anti-ERK2 antibodies. Data shown in lower panel are means SEM (n = 3); ns no significance, ***P < 0.001 by Dunnett’s range test following one-way ANOVA comparing to no carbachol addition. e MIN6 cells were pre-treated with U73122 (1 μM) for 30 min prior to treatment with carbachol (1 mM, 2 min). Proteins were separated by SDS–PAGE and detected by Western blotting using anti-phospho-ERK1/2 and anti-ERK2 antibodies. Lower panel are means SEM (n = 3). Data were analyzed by a Student’s 2-tailed t test; ***P < 0.001. All immunoblots shown are representative of three independent experiments
Fig. 2
Fig. 2
Role of Ras and MEK in carbachol-stimulated ERK1/2 activation. a MIN6 cells were infected with a control adenovirus (AdEmpty.eGFP) or with an adenovirus engineered for expression of RasN17 (AdRasN17). After 48 h, cells were pre-incubated for 1 h with KRB-minus-glucose before treatment with carbachol (1 mM, 2 min), EGF (20 ng/ml, 5 min) or GLP-1 (10 nM) plus 16.7 mM glucose for 10 min. b MIN6 cells were pre-incubated for 1 h in KRB and where indicated PD098059 (PD, 1 μM) or U0126 (20 μM) was added for the last 30 min before addition of carbachol (1 mM, 2 min). Proteins were separated by SDS–PAGE and detected by Western blotting using anti-phospho-ERK1/2 and anti-ERK2 antibodies. Below each representative blot is a graph showing densitometric quantification of ERK1/2 phosphorylation. Data are presented as means SEM (n = 3); ***P < 0.001 by Dunnett’s range test following one-way ANOVA compared to the carbachol response
Fig. 3
Fig. 3
PKC requirement for carbachol-mediated ERK1/2 activation. MIN6 cells, transfected to express eGFP-tagged PKCε, were pre-incubated for 1 h in KRB-minus-glucose prior to treatment with a carbachol (1 mM) or b TPA (1 μM). Fluorescence intensity in the (i) cytoplasm or (ii) at the membrane was monitored by fluorescence confocal microscopy. Changes in fluorescence intensity were expressed relative to initial fluorescence (F/F 0). c, d MIN6 cells pre-treated in the absence or presence of TPA (1 μM) for 16 h (TPA o/n) were pre-incubated for 1 h in KRB-minus-glucose prior to treatment with c carbachol (1 mM, 2 min) or d TPA (1 μM, 60 min) in the absence or presence of bisindolylmaleimide I (BIM, 1 μM), Ro 32-0432 (Ro32, 1 μM), or Gö6976 (Go69, 1 μM). Proteins were separated by SDS–PAGE and detected by Western blotting using anti-phospho-ERK1/2 and anti-ERK2 antibodies. Representative blots are shown above with mean data densitometry below in panels c and d. Data are shown as means + SEM (n = 3); ***P < 0.001 by Dunnett’s range test following one-way ANOVA compared to carbachol (panel c) or TPA (panel d)
Fig. 4
Fig. 4
Ca2+ influx across the plasma membrane is required for carbachol-stimulated ERK1/2 activation. a MIN6 cells were pre-incubated for 30 min in KRB-minus-glucose and, where indicated, loaded with BAPTA-AM (100 μM, BAPTA) for 30 min. Cells were then treated with carbachol (1 mM, 2 min). Proteins were separated by SDS–PAGE and detected by Western blotting using anti-phospho-ERK1/2 and anti-ERK2 antibodies. A representative blot is shown above with mean data densitometry below. Data are shown as means SEM (n = 3); ***P < 0.001 by Dunnett’s range test following one-way ANOVA compared to carbachol. b Cells were loaded with Fluo-4-AM (2 μM) at the same time as BAPTA-AM and [Ca2+]i measured using single-cell confocal Ca2+ imaging following carbachol (1 mM) addition. Data represent means SEM for the increase in [Ca2+]i levels (n > 30). c MIN6 cells were pre-incubated for 30 min in KRB-minus-glucose and, where indicated, incubated in EGTA-buffered KRB for the last 10 min. The Ca2+ concentration in the KRB was reduced to ≤ 100 nM by EGTA-buffering and confirmed using Fura-2 free acid and standard fluorimetry. Carbachol (1 mM) was added to the KRB for 2 min. Proteins were separated by SDS–PAGE and detected by Western blotting using anti-phospho-ERK1/2 and anti-ERK2 antibodies. A representative blot is shown above with densitometry below. Data are means SEM (n > 3); ***P < 0.001 by Dunnett’s range test following one-way ANOVA compared to carbachol. d Changes in [Ca2+]i were assessed by single-cell confocal Ca2+ imaging reproducing the experimental conditions used in panel c
Fig. 5
Fig. 5
Multiple Ca2+ sources are required for carbachol-stimulated ERK1/2 activation. a MIN6 cells were pre-incubated for 1 h with KRB-minus-glucose in the absence or presence of 2APB (10 μM) for 30 min, or nifedipine (10 μM), xestospongin C (10 μM) or diazoxide (250 μM) for 10 min prior to carbachol (1 mM, 2 min) addition. Proteins were separated by SDS–PAGE and detected by Western blotting using anti-phospho-ERK1/2 and anti-ERK2 antibodies. A representative blot is shown above with mean data densitometry below. Data are shown as means SEM (n = 3); *P < 0.05; ***P < 0.001 by Dunnett’s range test following one-way ANOVA compared to carbachol addition. b [Ca2+]i was monitored in populations of MIN6 cells pre-treated as in a by NOVOstar platereader. Data are shown as means SEM (n = 3); *P < 0.05; ***P < 0.001 by Dunnett’s range test following one-way ANOVA compared to carbachol addition. c MIN6 cells transfected with the cameleon D1ER construct were pre-incubated for 1 h in KRB-minus-glucose. Cells were then incubated in the absence or presence of 2ABP (10 μM) or xestospongin C (10 μM) for 10 min before the addition of carbachol (Cch, 1 mM). Data shown represent peak FRET changes after agonist addition. d MIN6 cells were treated as in a, but in the absence or presence of thapsigargin (1 μM) pre-addition for 10 min. A representative blot is shown above with mean data densitometry below. e MIN6 cells were maintained in KRB in which Na+ was replaced by methylglucamine for 15 min before stimulation with either glucose (20 mM) or carbachol (1 mM). Data are shown as means SEM (n = 3); *P < 0.05; ***P < 0.001 by Dunnett’s range test following one-way ANOVA compared to carbachol. f MIN6 cells transfected with cameleon D1ER were pre-incubated for 1 h in KRB-minus-glucose prior to recording. All recordings show 1 min of basal KRB perfusion before either no pre-treatment or thapsigargin (1 μM) addition for 10 min followed by the addition of carbachol (1 mM) for 5 min. Data shown represent mean changes in FRET for n ≥ 30 cells. g MIN6 cells were pre-incubated in KRB-minus-glucose and then treated with carbachol (1 mM, black line) or thapsigargin (1 μM, gray line) for 10 min followed by the addition of carbachol (1 mM). Fluorescence was measured as an indicator of [Ca2+]i by NOVOstar platereader for 10 s before initial Cch/thapsigargin pre-treatments
Fig. 6
Fig. 6
Changes in phosphoinositide turnover in MIN6 cells in response to carbachol. a MIN6 cells were transfected with a plasmid encoding eGFP-PHPLCδ1. Cells were then pre-treated for 1 h with KRB-minus-glucose and treated with carbachol (1 mM). Changes in fluorescence intensity at the plasma membrane (i) or in the cytoplasm (ii) were determined by confocal microscopy. Fluorescence intensity was referenced to the initial fluorescence (F/F 0). The area under the baseline for membrane fluorescence or over the baseline for cytoplasmic fluorescence was calculated and compared between control and carbachol-stimulated cells. Data are presented as means SEM (n > 30). b MIN6 cells were incubated with [3H]inositol for 48 h. Cells were pre-incubated for 1 h with KRB-minus-glucose and, where indicated, LiCl (10 mM) was added for the final 30 min. Cells were challenged with carbachol (1 mM) for the times indicated and [3H]IPx and [3H]PtdIns(Px) fractions recovered and analyzed as described in the “Methods” section. Time-dependent effects of carbachol stimulation on (i) [3H]IPx accumulations in the absence and presence of LiCl and (ii) [3H]PtdIns, [3H]PtdInsP and [3H]PtdInsP2. Data are shown as means + SEM for 3 independent experiments performed in duplicate
Fig. 7
Fig. 7
Schematic synopsis of the mechanisms of carbachol-stimulated ERK1/2 activation in MIN6 cells. (1) Agonist binding to the mAchR activates PLC resulting in phosphoinositide hydrolysis and the production of IP3; (2) activation of IP3Rs in the ER increases cytoplasmic [Ca2+]; (3) plasma membrane store-operated channels mediate Ca2+ entry; (4) KATP channels are inactivated; (5) steps 2–4 converge resulting in depolarization and Ca2+ entry through L-type VGCCs. The increase in [Ca2+]i results in ERK1/2 activation

References

    1. Ahren B. Autonomic regulation of islet hormone secretion—implications for health and disease. Diabetologia. 2000;43(4):393–410. doi: 10.1007/s001250051322. - DOI - PubMed
    1. Gilon P, Henquin JC. Mechanisms and physiological significance of the cholinergic control of pancreatic beta-cell function. Endocr Rev. 2001;22(5):565–604. doi: 10.1210/er.22.5.565. - DOI - PubMed
    1. Gautam D, Han SJ, Hamdan FF, Jeon J, Li B, Li JH, Cui Y, Mears D, Lu H, Deng C, Heard T, Wess J. A critical role for beta cell M3 muscarinic acetylcholine receptors in regulating insulin release and blood glucose homeostasis in vivo. Cell Metab. 2006;3(6):449–461. doi: 10.1016/j.cmet.2006.04.009. - DOI - PubMed
    1. Kanat M, Norton L, Winnier D, Jenkinson C, Defronzo RA, Abdul-Ghani MA Impaired early- but not late-phase insulin secretion in subjects with impaired fasting glucose. Acta Diabetol. doi:10.1007/s00592-011-0285-x - PubMed
    1. Gromada J, Hughes TE. Ringing the dinner bell for insulin: muscarinic M3 receptor activity in the control of pancreatic beta cell function. Cell Metab. 2006;3(6):390–392. doi: 10.1016/j.cmet.2006.05.004. - DOI - PubMed

Publication types

MeSH terms

LinkOut - more resources