

Quantification of histone modification ChIP-seq enrichment for data mining and machine learning applications
- PMID: 21834981
- PMCID: PMC3170335
- DOI: 10.1186/1756-0500-4-288
Quantification of histone modification ChIP-seq enrichment for data mining and machine learning applications
Abstract
Background: The advent of ChIP-seq technology has made the investigation of epigenetic regulatory networks a computationally tractable problem. Several groups have applied statistical computing methods to ChIP-seq datasets to gain insight into the epigenetic regulation of transcription. However, methods for estimating enrichment levels in ChIP-seq data for these computational studies are understudied and variable. Since the conclusions drawn from these data mining and machine learning applications strongly depend on the enrichment level inputs, a comparison of estimation methods with respect to the performance of statistical models should be made.
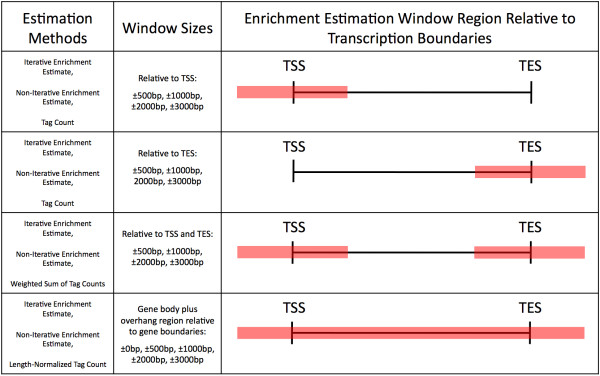
Results: Various methods were used to estimate the gene-wise ChIP-seq enrichment levels for 20 histone methylations and the histone variant H2A.Z. The Multivariate Adaptive Regression Splines (MARS) algorithm was applied for each estimation method using the estimation of enrichment levels as predictors and gene expression levels as responses. The methods used to estimate enrichment levels included tag counting and model-based methods that were applied to whole genes and specific gene regions. These methods were also applied to various sizes of estimation windows. The MARS model performance was assessed with the Generalized Cross-Validation Score (GCV). We determined that model-based methods of enrichment estimation that spatially weight enrichment based on average patterns provided an improvement over tag counting methods. Also, methods that included information across the entire gene body provided improvement over methods that focus on a specific sub-region of the gene (e.g., the 5' or 3' region).
Conclusion: The performance of data mining and machine learning methods when applied to histone modification ChIP-seq data can be improved by using data across the entire gene body, and incorporating the spatial distribution of enrichment. Refinement of enrichment estimation ultimately improved accuracy of model predictions.
Figures


Similar articles
-
Application of machine learning methods to histone methylation ChIP-Seq data reveals H4R3me2 globally represses gene expression.BMC Bioinformatics. 2010 Jul 23;11:396. doi: 10.1186/1471-2105-11-396. BMC Bioinformatics. 2010. PMID: 20653935 Free PMC article.
-
Nonparametric Tests for Differential Histone Enrichment with ChIP-Seq Data.Cancer Inform. 2015 Jan 27;14(Suppl 1):11-22. doi: 10.4137/CIN.S13972. eCollection 2015. Cancer Inform. 2015. PMID: 25657574 Free PMC article.
-
Genome-wide localization of protein-DNA binding and histone modification by a Bayesian change-point method with ChIP-seq data.PLoS Comput Biol. 2012;8(7):e1002613. doi: 10.1371/journal.pcbi.1002613. Epub 2012 Jul 26. PLoS Comput Biol. 2012. PMID: 22844240 Free PMC article.
-
Role of ChIP-seq in the discovery of transcription factor binding sites, differential gene regulation mechanism, epigenetic marks and beyond.Cell Cycle. 2014;13(18):2847-52. doi: 10.4161/15384101.2014.949201. Cell Cycle. 2014. PMID: 25486472 Free PMC article. Review.
-
Determination of the best multivariate adaptive geographically weighted generalized Poisson regression splines model employing generalized cross-validation in dengue fever cases.MethodsX. 2023 Apr 7;10:102174. doi: 10.1016/j.mex.2023.102174. eCollection 2023. MethodsX. 2023. PMID: 37122365 Free PMC article. Review.
Cited by
-
Integrated analysis and transcript abundance modelling of H3K4me3 and H3K27me3 in developing secondary xylem.Sci Rep. 2017 Jun 13;7(1):3370. doi: 10.1038/s41598-017-03665-1. Sci Rep. 2017. PMID: 28611454 Free PMC article.
-
OccuPeak: ChIP-Seq peak calling based on internal background modelling.PLoS One. 2014 Jun 17;9(6):e99844. doi: 10.1371/journal.pone.0099844. eCollection 2014. PLoS One. 2014. PMID: 24936875 Free PMC article.
-
The FBXL10/KDM2B scaffolding protein associates with novel polycomb repressive complex-1 to regulate adipogenesis.J Biol Chem. 2015 Feb 13;290(7):4163-77. doi: 10.1074/jbc.M114.626929. Epub 2014 Dec 22. J Biol Chem. 2015. PMID: 25533466 Free PMC article.
-
JMJD1A is a signal-sensing scaffold that regulates acute chromatin dynamics via SWI/SNF association for thermogenesis.Nat Commun. 2015 May 7;6:7052. doi: 10.1038/ncomms8052. Nat Commun. 2015. PMID: 25948511 Free PMC article.
-
Differential roles for MBD2 and MBD3 at methylated CpG islands, active promoters and binding to exon sequences.Nucleic Acids Res. 2013 Mar 1;41(5):3010-21. doi: 10.1093/nar/gkt035. Epub 2013 Jan 29. Nucleic Acids Res. 2013. PMID: 23361464 Free PMC article.
References
Grants and funding
LinkOut - more resources
Full Text Sources
Miscellaneous
