. 2011 Oct;179(4):2053-70.
doi: 10.1016/j.ajpath.2011.07.001. Epub 2011 Aug 9.

Ablation of TNF-RI/RII expression in Alzheimer's disease mice leads to an unexpected enhancement of pathology: implications for chronic pan-TNF-α suppressive therapeutic strategies in the brain

Affiliations

Ablation of TNF-RI/RII expression in Alzheimer's disease mice leads to an unexpected enhancement of pathology: implications for chronic pan-TNF-α suppressive therapeutic strategies in the brain

Sara L Montgomery et al. Am J Pathol. 2011 Oct.

Abstract

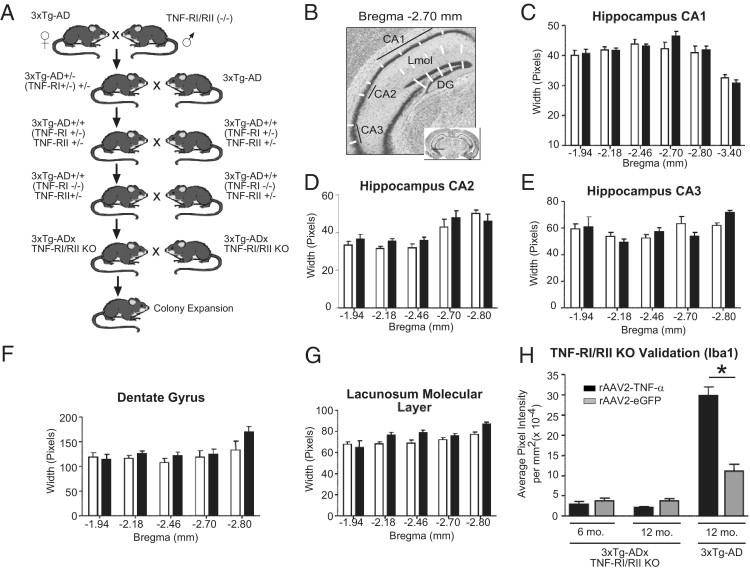
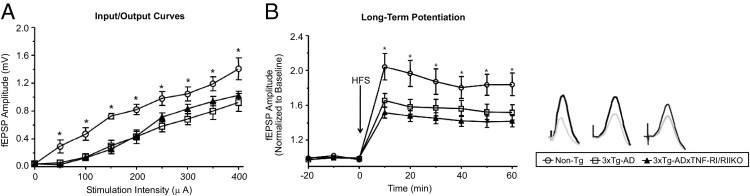
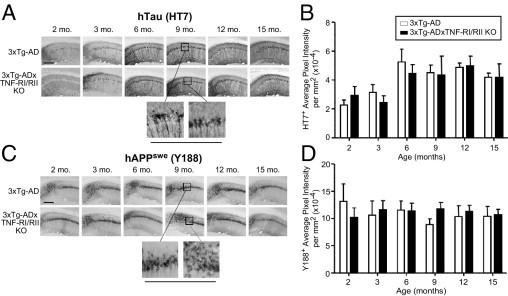
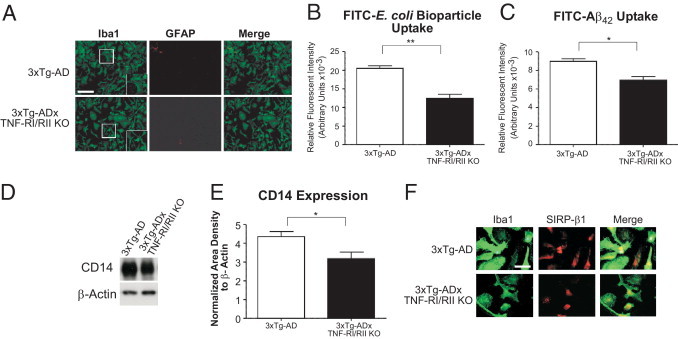
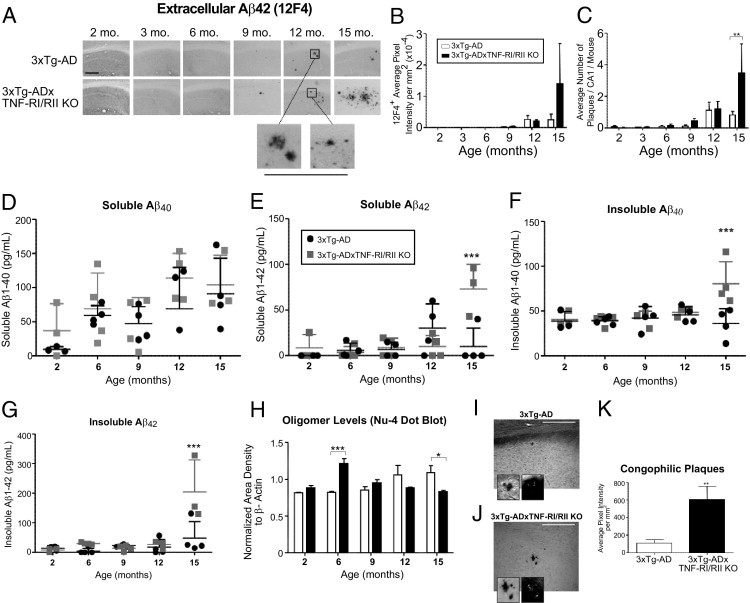
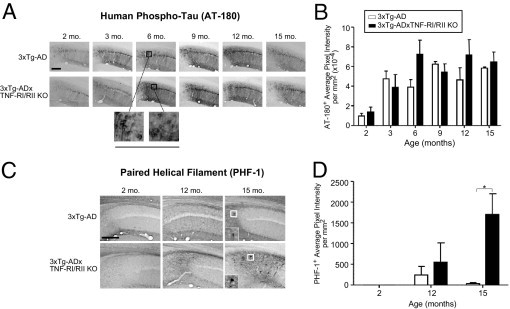
Alzheimer's disease (AD) is a progressive neurodegenerative disorder characterized by severe memory loss and cognitive impairment. Neuroinflammation, including the extensive production of pro-inflammatory molecules and the activation of microglia, has been implicated in the disease process. Tumor necrosis factor (TNF)-α, a prototypic pro-inflammatory cytokine, is elevated in AD, is neurotoxic, and colocalizes with amyloid plaques in AD animal models and human brains. We previously demonstrated that the expression of TNF-α is increased in AD mice at ages preceding the development of hallmark amyloid and tau pathological features and that long-term expression of this cytokine in these mice leads to marked neuronal death. Such observations suggest that TNF-α signaling promotes AD pathogenesis and that therapeutics suppressing this cytokine's activity may be beneficial. To dissect TNF-α receptor signaling requirements in AD, we generated triple-transgenic AD mice (3xTg-AD) lacking both TNF-α receptor 1 (TNF-RI) and 2 (TNF-RII), 3xTg-ADxTNF-RI/RII knock out, the cognate receptors of TNF-α. These mice exhibit enhanced amyloid and tau-related pathological features by the age of 15 months, in stark contrast to age-matched 3xTg-AD counterparts. Moreover, 3xTg-ADxTNF-RI/RII knock out-derived primary microglia reveal reduced amyloid-β phagocytic marker expression and phagocytosis activity, indicating that intact TNF-α receptor signaling is critical for microglial-mediated uptake of extracellular amyloid-β peptide pools. Overall, our results demonstrate that globally ablated TNF receptor signaling exacerbates pathogenesis and argues against long-term use of pan-anti-TNF-α inhibitors for the treatment of AD.


Figures

Figure 1
Figure 1
Generation and verification of 3xTg-ADxTNF-RI/RII KO transgenic mice. A: A schematic representation of the breeding strategy between 3xTg-AD and C57BL/6 double TNF-RI/RII knockout mice that yielded 3xTg-ADxTNF-RI/RII KO mice. The gross neuroanatomical structure of 2-month-old 3xTg-AD (white bars) and 3xTg-ADxTNF-RI/RII KO (black bars) mice was assessed by Nissl IHC (B) and measuring the width of the CA1 (C), CA2 (D), and CA3 (E) layers, the DG (F), and the lacunosum molecular layer (G) of the hippocampal formation. Two-way analysis of variance with the Bonferroni's posttest was used to assess statistical significance (N = 3 to 7). H: Iba1-positive microglia of 12-month-old 3xTg-AD and 6- and 12-month-old 3xTg-ADxTNF-RI/RII KO mice after long-term overexpression of AAV2–TNF-α and AAV2-eGFP. Statistical analyses were performed using a one-way analysis of variance and Bonferroni's posttest between AAV2–TNF-α and AAV2-eGFP infused mice for each genotype. *P < 0.001. N = 3 to 4. Error bars represent SEM.
Figure 2
Figure 2
Characterization of hippocampal synaptic function in 3xTg-ADxTNF-RI/RII KO, 3xTg-AD, and Non-Tg mice. A: Input-output curves showing average fEPSP amplitude in the stratum radiatum of CA1 in response to single-pulse stimulation to the contralateral CA3 area at increasing stimulation intensities before acquisition of baseline recordings in 3xTg-ADxTNF-RI/RII KO (n = 8), 3xTg-AD (n = 9), and Non-Tg (n = 6) mice. Average fEPSP amplitude in CA1 increased similarly in all three groups with increasing stimulation intensities. An analysis of variance was performed comparing fEPSP amplitude across stimulation intensities in all three groups: significant effect of group, F2,20 = 6.6, P = 0.006; significant effect of stimulation, F8,160 = 82.8, P < 0.01; nonsignificant group by stimulation interaction, F8,160 = 1.3, P = 0.185. The simple effects of stimulation were significant for all animals receiving increasing stimulation intensities: Non-Tg (F8,56 = 49.4, P < 0.01), 3xTg-ADxTNF-RI/RII KO (F8,56 = 32.3, P < 0.01), and 3xTg-AD (F8,64 = 22.7, P < 0.01) mice. Moreover, 3xTg-ADxTNF-RI/RII KO and 3xTg-AD mice showed similar levels of fEPSP amplitude with increasing stimulus strength. Analyses of variance showed a nonsignificant effect of group (F1,151 = 0.2, P = 0.597), a significant effect of stimulation (F8,120 = 54.3, P < 0.01), and a nonsignificant group by stimulation interaction (F8,120 = 0.6, P = 0.742). Tukey's post hoc analysis showed that 3xTg-ADxTNF-RI/RII KO and 3xTg-AD mice showed significantly smaller evoked fEPSPs compared with Non-Tg mice (P = 0.02), indicating similar levels of impaired basal synaptic transmission in these animals. B: Left: The application of an HFS episode (100 pulses at 100 Hz) to the CA3 hippocampal area elicited robust LTP in CA1 in Non-Tg animals (n = 6) that lasted for at least 1 hour after LTP induction. The levels of hippocampal LTP in response to HFS were significantly diminished to comparable levels in both 3xTg-ADxTNF-RI/RII KO (n = 8) and 3xTg-AD (n = 9) mice. Analyses of variance comparing fEPSP amplitude in all three groups showed a significant effect of group (F2,20 = 4.5, P = 0.024), a significant effect of time (F8,160 = 100.5, P < 0.01), and a significant group by time interaction (F16,160 = 3.9, P < 0.01); for 3xTg-ADxTNF-RI/RII KO versus 3xTg-AD mice, there was a nonsignificant effect of group (F1,15 = 1.1, P = 0.300), a significant effect of time (F8,96 = 74.2, P < 0.01), and a nonsignificant group by time interaction (F8,120 = 1.2, P = 0.295); for 3xTg-ADxTNF-RI/RII KO versus Non-Tg mice, there was a significant effect of group (F1,12 = 7.8, P = 0.016), a significant effect of time (F8,96 = 63.4, P < 0.01), and a significant group by time interaction (F8,96 = 6.9, P < 0.0); for 3xTg-AD versus Non-Tg mice, there was a nonsignificant effect of group (F1,13 = 3.7, P = 0.074), a significant effect of time (F8,104 = 64.4, P < 0.01), and a significant group by time interaction (F8,104 = 3.0, P = 0.04). Right: fEPSPs during baseline (gray) and at the end of the experiment (black) for a Non-Tg (left), a 3xTg-AD (middle), and a 3xTg-ADxTNF-RI/RII KO (right) mouse receiving HFS (fEPSPs are averages of 10 individual sweeps, calibration is 10 milliseconds and 1.0 mV). *P < 0.05 between Non-Tg and transgenic animals (significant difference).
Figure 3
Figure 3
Human tauP301L and APPswe transgenes are expressed comparably in 3xTg-AD and 3xTg-ADxTNF-RI/RII KO mice. Coronal brain sections from 2-, 3-, 6-, 9-, 12-, and 15-month-old 3xTg-AD and 3xTg-ADxTNF-RI/RII KO mice were subjected to DAB IHC for human tauP301L transgene product using the HT7 antibody (A) and human APPswe transgene product using the Y188 antibody (C). Representative ×10 images are depicted. Underlined panels are digitally enhanced images six times the designated immunostained CA1 layer to better depict cellular morphological features. The staining intensities for HT7+ (B) and Y188+ (D) cells were determined for stained 3xTg-AD and 3xTg-ADxTNF-RI/RII KO brain sections. Statistical analyses were performed using a two-way analysis of variance with a Bonferroni's posttest. Error bars represent SEM (N = 3 to 7). Scale bars: 500 μm (A and C).
Figure 4
Figure 4
Loss of TNF-RI/RII expression does not alter astrocyte staining intensities but does lead to a blunting of Iba1+ microglia/macrophage levels compared with age-matched 3xTg-AD mice. Coronal brain sections from 2-, 3-, 6-, 9-, 12-, and 15-month-old 3xTg-AD and 3xTg-ADxTNF-RI/RII KO mice were subjected to DAB IHC for microglia using an Iba1-specific antibody (A) and astrocytes using a GFAP-specific antibody (C). Representative ×10 images are depicted. Underlined panels are digitally enhanced images six times the designated immunostained CA1 layer to better depict cellular morphological features. The staining intensities for Iba1+ (B) and GFAP+ (D) cells were determined for stained 3xTg-AD and 3xTg-ADxTNF-RI/RII KO brain sections. Statistical analyses were performed using a two-way analysis of variance with a Bonferroni's posttest. *P < 0.01. Error bars represent SEM (N = 3 to 7). Scale bars: 500 μm (A and C).
Figure 5
Figure 5
Ablated TNF-α receptor expression reduces general and Aβ42 peptide phagocytosis activity and CD14 surface expression but not SIRP-β1 levels of 3xTg-ADxTNF-RI/RII KO microglia. Primary microglial cultures were established from postnatal day 1 (P1) 3xTg-AD and 3xTg-ADxTNF-RI/RII KO pups and plated onto glass coverslips at a density of 4 × 10⁴ cells/well. A: Cells were stained with Iba1- and GFAP-specific antibodies to detect microglia and astrocytes, respectively. Fluorescent images were taken under ×20 magnification, and merged signals are also shown. Insets: Digitally enhanced images at ×1.5. Error bars represent SEM. Scale bar = 200 μm (A). P1 3xTg-AD and 3xTg-ADxTN-RI/RII KO pups were used to determine the general phagocytic activity of primary microglial cells in the presence of FITC–E. coli bioparticles (B). Cells were plated at 20,000 cells/well in a 96-well culture plate and treated 24 hours later with FITC–E. coli bioparticles or vehicle control for an additional 8 hours. A parallel experiment was performed to assess the uptake of FITC-labeled Aβ42 (C). Extracellular FITC signal was quenched with trypan blue and subsequently the fluorescent intensity was measured. Error bars represent SEM. Statistical analyses were performed using a two-tailed nonparametric Student's t-test. *P < 0.05, **P < 0.001. N = 8. D: CD14 expression detected by Western blot analysis for 3xTg-AD and 3xTg-ADxTNF-RI/RII KO primary microglia. E: Quantification of band intensities and normalization to β-actin. Statistical analyses were performed using a two-tailed nonparametric Student's t-test. *P < 0.05. N = 4. F: SIRP-β1 and Iba1 were concurrently stained using 3xTg-AD and 3xTg-ADxTNF-RI/RII KO microglia. Immunofluorescent images were captured for SIRP-β1– and Iba1-positive cells. Merged images are also depicted. Scale bar = 50 μm (F).
Figure 6
Figure 6
Fifteen-month-old 3xTg-ADxTNF-RI/RII KO mice exhibit elevated extracellular Aβ plaque load, soluble Aβ42, insoluble Aβ40, and Aβ42 protein levels and congophilic plaques compared with 3xTg-AD counterparts. A: Coronal brain sections from 2-, 3-, 6-, 9-, 12-, and 15-month-old 3xTg-AD and 3xTg-ADxTNF-RI/RII KO mice were subjected to DAB IHC for extracellular Aβ42 using a human Aβ42-specific antibody. Representative ×10 images are depicted. Underlined panels are digitally enhanced images six times the designated immunostained CA1 layer to better depict deposit morphological features. Scale bar = 500 μm (A). The staining intensities (B) and counts (C) for Aβ42 were determined for stained 3xTg-AD and 3xTg-ADxTNF-RI/RII KO brain sections. Statistical analyses were performed using a two-way analysis of variance with a Bonferroni's posttest. Error bars represent SEM. N = 3 to 7. **P < 0.01. Soluble and insoluble Aβ40 (D and F, respectively) and Aβ42 (E and G, respectively) levels were measured in hippocampal tissue homogenates diluted 1:5 from 2-, 6-, 9-, 12-, and 15-month-old 3xTg-AD and 3xTg-ADxTNF-RI/RII mice. H: A dot blot analysis was implemented to detect Nu-4 expression of oligomeric forms of amyloid protein from 2-, 6-, 9-, 12-, and 15-month-old 3xTg-AD and 3xTg-ADxTNF-RI/RII KO mice using hippocampal tissue homogenates. The statistical significance of Aβ enzyme-linked immunosorbent assays and an Nu-4 dot blot was determined by two-way analysis of variance and Bonferroni's posttest. N = 4. *P < 0.05, ***P < 0.001. IK: Congophilic plaques were visualized and quantified in 15-month-old 3xTg-AD and 3xTg-ADxTNF-RI/RII KO mice (N = 4). Insets: ×60 magnification showing enhanced plaque morphological features and birefringence of β-sheet secondary structure under polarized light. A two-tailed Student's t-test was performed for statistical analysis. **P < 0.05. Scale bars: 50 μm (I and J). Error bars in I and J are SEM.
Figure 7
Figure 7
3xTg-ADxTNF-RI/RII KO mice display exacerbated PHF immunostaining at the age of 15 months. Coronal brain sections from 2-, 3-, 6-, 9-, 12-, and 15-month-old 3xTg-AD and 3xTg-ADxTNF-RI/RII KO mice were subjected to DAB IHC for phospho-tau using the AT-180 antibody (A) and PHF tau (Ser396 or Ser404) using the PHF-1 antibody (C). Representative ×10 images are depicted. Underlined panels and insets are digitally enhanced images six times the designated immunostained CA1 layer to better depict cellular morphological features. The staining intensities for AT-180+ (B) and PHF-1+ (D) cells were determined for stained 3xTg-AD and 3xTg-ADxTNF-RI/RII KO brain sections. Statistical analyses were performed using a two-way analysis of variance with a Bonferroni's posttest. *P < 0.05. Error bars represent SEM. N = 3 to 7. Scale bars: 500 μm (A and C).

Similar articles

Cited by

References

    1. Akiyama H., Barger S., Barnum S., Bradt B., Bauer J., Cole G.M. Inflammation and Alzheimer's disease. Neurobiol Aging. 2000;21:383–421. - PMC - PubMed
    1. McGeer E.G., McGeer P.L. Inflammatory processes in Alzheimer's disease. Prog Neuropsychopharmacol Biol Psychiatry. 2003;27:741–749. - PubMed
    1. Meda L., Cassatella M.A., Szendrei G.I., Otvos L., Jr, Baron P., Villalba M., Ferrari D., Rossi F. Activation of microglial cells by beta-amyloid protein and interferon-gamma. Nature. 1995;374:647–650. - PubMed
    1. Huberman M., Shalit F., Roth-Deri I., Gutman B., Brodie C., Kott E., Sredni B. Correlation of cytokine secretion by mononuclear cells of Alzheimer patients and their disease stage. J Neuroimmunol. 1994;52:147–152. - PubMed
    1. Motta M., Imbesi R., Di Rosa M., Stivala F., Malaguarnera L. Altered plasma cytokine levels in Alzheimer's disease: correlation with the disease progression. Immunol Lett. 2007;114:46–51. - PubMed

Publication types

MeSH terms