. 2011 Aug 11;71(3):433-46.
doi: 10.1016/j.neuron.2011.06.041.

Semaphorin3A regulates neuronal polarization by suppressing axon formation and promoting dendrite growth

Affiliations

Semaphorin3A regulates neuronal polarization by suppressing axon formation and promoting dendrite growth

Maya Shelly et al. Neuron. .

Abstract

Semaphorin 3A (Sema3A) is a secreted factor known to guide axon/dendrite growth and neuronal migration. We found that it also acts as a polarizing factor for axon/dendrite development in cultured hippocampal neurons. Exposure of the undifferentiated neurite to localized Sema3A suppressed its differentiation into axon and promoted dendrite formation, resulting in axon formation away from the Sema3A source, and bath application of Sema3A to polarized neurons promoted dendrite growth but suppressed axon growth. Fluorescence resonance energy transfer (FRET) imaging showed that Sema3A elevated the cGMP but reduced cAMP and protein kinase A (PKA) activity, and its axon suppression is attributed to the downregulation of PKA-dependent phosphorylation of axon determinants LKB1 and GSK-3β. Downregulating Sema3A signaling in rat embryonic cortical progenitors via in utero electroporation of siRNAs against the Sema3A receptor neuropilin-1 also resulted in polarization defects in vivo. Thus, Sema3A regulates the earliest step of neuronal morphogenesis by polarizing axon/dendrite formation.


Figures

Figure 1
Figure 1. Opposite Effects of Sema3A on Axon and Dendrite Differentiation
(A) Images of an example hippocampal neuron cultured on substrates coated with stripes (blue) of Sema3A, taken at 12 and 60 hr after cell plating and immunostaining (at 60 hr) for axons and dendrites with smi-312 and MAP2 antibodies, respectively. White arrows and arrowheads mark neurites that later became the axon and dendrites, respectively. Yellow symbols mark axon/dendrite turning at the stripe boundary. Scale is 10 μm. (B) Preferential axon/dendrite differentiation was quantified retrospectively at 48-60 hr after plating, for polarized neurons with somata located at the stripe boundary. (a) Schematic diagram depicts the determination of the angular location of neurite initiation sites on the soma for all neurites that became the axon or dendrites at 48-60 hr. The initiation site (marked by the circle) was determined relative to the center of the stripe boundary intersecting the soma (axon, green; dendrites, red). (b) Angular locations of all initiation sites, either “on-stripe” (blue circles) or “off-stripe” (black circles), for axons (30 cells) and dendrites (10 cells) initiated on substrates striped with Sema3A, BDNF, NGF, or netrin1. Scale is 5 μm. (C) Summary of preferential axon/dendrite differentiation (a) and pathfinding (b) for all neurons cultured on substrates striped with various factors indicated. Preference index (PI) was defined as [(% on stripe) − (% off stripe)] / 100%. Data shown are average PIs for axon/dendrite differentiation for neurons with somata located on the stripe boundary (a), and pathfinding for all neurons (b), determined at 48-60 hr after cell plating. Substrates were stripe-coated with BSA, Sema3A, BDNF, NGF, netrin1, F-cAMP, or F-cGMP, either alone or together with KT5720 or KT5823. Treatments included transfection with GFP-LKB1S431D, NP1-siRNA or control siRNA. Data represents average ± SD (n = 50 - 75 cells, 3 cultures each). Significant differences were found for all treatments from corresponding values found for BSA stripes (P < 0.001, two tailed t-test or Kolmogorov-Smirnov test).
Figure 2
Figure 2. Sema3A Induces Elevation of cGMP and Reduction of cAMP/PKA in a PKG- and PDE-Dependent Manner
(A) Summary of the average FRET signal for all 16-hr hippocampal neurons expressing the FRET sensors for cGMP (cGES-DE5), cAMP (ICUE), or PKA activity (AKAR), before and after bath application of Sema3A (a) or BDNF (b) observed at the neurite. The YFP/CFP fluorescence intensity ratio for the PKA-activity and the cGMP probes and the CFP/YFP fluorescence intensity ratio for the cAMP sensor representing the FRET signal were averaged over 40s for each cell and normalized by the mean control value before Sema3A or BDNF application. Data points are average ± SEM (n = 5 cells each, up to two neurites per cell). (B) The role of PDEs and PKG in Sema3A-induced regulation of cGMP and cAMP/PKA. The data represent average Sema3A-induced (± SEM, n = 5 cells each, up to two neurites per cell) FRET signals for cGMP (a), cAMP (b), or PKA activity (c), measured at the neurite, at 10-20 min after bath application of Sema3A following pre-incubation with various drugs, as compared to the FRET signal prior to Sema3A application. Drug treatments included: sGC inhibitor ODQ, PKG inhibitor KT5823, general PDE inhibitor IBMX, or cAMP-specific PDE4 inhibitor rolipram. Data include those shown in A.
Figure 3
Figure 3. Sema3A Antagonizes cAMP- and BDNF-Induced Phosphorylation of LKB1 and GSK-3β in a PKG- and PDE-Dependent Manner
(A, B) Immunoblots of total cell lysates of 5-d cultures of cortical neurons, with phosphorylation site-specific antibodies targeted at the PKA site-S431 of LKB1, S9 of GSK-3β, and with protein-specific antibodies. Cells were treated with forskolin (A) or BDNF (B) either alone or together with increasing concentrations of Sema3A, in the absence or presence of KT5823, ODQ, IBMX, or rolipram. Note that the phosphorylation of LKB1 at S431 correlated with an elevated LKB1 level. Histograms below show the average phosphorylation level of pLKB1-S431 and pGSK-3β, normalized to β-actin, shown as fold of control (± SD, n = 3). All values are significantly higher than the control (p < 0.01, t-test). (C) Peptide-based assays of PKA activity show that the antagonistic effect of Sema3A on BDNF-induced PKA activation depended on PDE and PKG activation. Total cell lysates of 16-hr cultures of hippocampal neurons were assayed for PKA activation using a fluorescent, PKA-specific peptide substrate (see Experimental Procedures). Cultures were treated with BDNF together with different concentrations of Sema3A, either alone or in combination, or left untreated. Above: peptide migration assay, with PKA activity indicated by the intensity of phosphorylated peptide migrating towards the cathode (“+”). Histograms show the average phosphorylated fluorescent peptide in cultures treated with BDNF either alone or together with increasing concentrations of Sema3A, in the absence or presence of KT5823 or IBMX, shown as the average percentage (± SD, n = 3) of change relative to control untreated cultures. (D) Antagonistic effect of cGMP activity on BDNF-induced LKB1 phosphorylation is mediated by cAMP-specific PDEs. Immunoblotting as in (A, B), with antibodies targeted at the phospho-S431 of LKB1 or the LKB1 protein. Cells were treated with BDNF, either alone or in combination with increasing concentrations of 8-pCPT-cGMP, and in the absence or presence of IBMX or rolipram. LKB1 phosphorylation at S431 (normalized to β-actin) is shown as fold of control (± SD, n = 3).
Figure 4
Figure 4. Polarized Distribution of pLKB1-S431 Induced by Local Sema3A Exposure
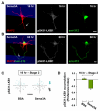
(A, B) Localized Sema3A inhibited LKB1 phosphorylation in undifferentiated neurites and axons. Example images of hippocampal neurons at 16 (A) and 60 (B) hr after cell plating, on substrates striped (blue) with Sema3A, co-immunostained with axon- and dendrite-specific marker smi-312 and MAP2, respectively, together with pLKB1-S431. Arrows: neurites or axons showing accumulation of pLKB1-S431 off the Sema3A stripe. Scale is 10 μm. (C) Preferential expression of pLKB1-S431 was quantified by the distribution of the initiation site for the neurite with highest accumulation of pLKB1-S431 among all neurites of the same neuron at 16 hr, for all neurons with somata located at the BSA or the Sema3A stripe boundary. Scale is 5 μm. (D) Summary of preferential pLKB1-S431 accumulation in neurites at 16 hr, using Preference Index (PI), as described in Figure 1.
Figure 5
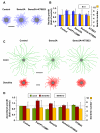
Figure 5. Sema3A Promotes Growth of Undifferentiated Neurites and Dendrites
(A, B) Sema3A promotes uniform growth of undifferentiated neurites. Hippocampal neurons were incubated with Sema3A in the bath from 2 hr after plating, and neurite lengths were measured at 9 hr. (A) Composite tracings depict undifferentiated neurites of 10 randomly sampled neurons in control or Sema3A-treated cultures in the absence or presence of KT5823. Scale is 50 μm. (B) Average neurite length and average neurite number (± SD; n = 3 cultures, 50-75 cells each) in parallel control untreated cultures, and cultures treated with the conditions indicated, shown as fold of control. (C, D) Sema3A promotes dendrite growth and suppresses axon growth in polarized neurons. Hippocampal neurons were incubated with Sema3A in the bath from 24 hr after plating. The average axon and dendrite lengths were measured at 48-60 hr following co-immunostaining with axon- and dendrite-specific marker smi-312 and MAP2, respectively. (C) Composite tracings depict randomly sampled cells (axons, 25 cells, green; dendrites, 15 cells, red) in control cultures or cultures treated with Sema3A, in the absence or presence of KT5823. Scale is 50 μm. (D) Histograms show the average axon and dendrite length and average dendrite number (± SD; n = 3 cultures, 50-75 cells each), in parallel control untreated cultures, and cultures treated with the conditions indicated, shown as fold of control.
Figure 6
Figure 6. Down-Regulation of neuropilin-1 Disrupted Polarity Formation of Cortical Neurons In Vivo
(A) Confocal images of GFP fluorescence of E21 rat cortices transfected via in utero electroporation at E18 (see Experimental Procedures) with the pRNAT-U6.3 vector expressing EGFP, together with either control siRNA or siRNAs directed against NP1. The panel on the left shows Hoechst staining for layer determination. Scale, 100 μm. (B) Higher magnification images of transfected cortical neurons, taken at the level of the ventricular zone (VZ) / subvemtricular zone (SVZ), the intermediate zone (IZ), and the cortical plate (CP), from similar slices as in (A). Arrows mark cells with wrong orientation with respect to the CP. Arrow heads mark cells with multipolar morphology. Scale is 50 μm. (C) Neuronal migration from the VZ/SVZ to the CP was quantified by determining the percentage of transfected cells located in the different layers for each treatment, from similar sections as in (A, B). Impeded radial migration was found for neurons expressing NP1 siRNAs at VZ/SVZ and CP levels (One Way Analysis of Variance, P < 0.001; post-hoc Student-Newman-Keuls Method P < 0.05). Histograms show the average percentage (± SEM). Numbers of animals analyzed are shown in parenthesis. (D) Quantitative measurements of the polarity of transfected cortical neurons, at the level of the VZ/SVZ, the IZ, and the CP, from similar sections as in (A, B). Histograms show the average percentage (± SEM, n = 8 animals) of neurons exhibiting unipolar/bipolar, multipolar or no process morphology in each layer. Numbers of cells analyzed are shown in the parenthesis. Neurons expressing NP1 siRNAs showed higher frequency of cells with multipolar morphology than control neurons at VZ/SVZ and IZ (One Way Analysis of Variance, P < 0.001; post-hoc Student-Newman-Keuls Method P < 0.05). (E) Tracings of representative neurons from similar sections as in (A, B), showing 2-D projection of the neuritic arbor of neurons transfected with different constructs, with neuronal orientation relative to cortical layers preserved. Scale is 50 μm. (F) Quantitation of the total neuritic length (a) and neuritic branch number (b) of multipolar neurons residing at the VZ/SVZ transfected with control or NP1 siRNAs. Data represent mean ± SEM. Only the total length of NP1 siRNA transfected cells (a) differed from control values (Mann-Whitney test, p = 0.002). Numbers in parentheses refer to the total number of cells analyzed. (G) Quantitation of the length of the leading process in bipolar neurons transfected with control or NP1 siRNAs at different cortical layers. Data represent mean ± SEM. Data for NP1 siRNA were significantly different from those for controls at IZ and CP (One Way Analysis of Variance on ranks, p < 0.001; post-hoc Dunn’s method, p < 0.05). Numbers in the parenthesis refer to the total number of cells analyzed. (H) The average total somatic EGFP-fluorescence in transfected multipolar or bipolar neurons at VZ/SVZ or IZ/CP respectively, was quantified as a measure of the extent of expression of control (a) or NP1 (b) siRNAs, normalized to the total fluorescence of all cells in the slice/experimental case, and plotted as a cumulative probability distribution curve. Data for NP1 siRNA transfected multipolar neurons at VZ/SVZ significantly differed from that of NP1 siRNA transfected bipolar neurons at IZ/CP (Kolmogorov-Smirnov test).

Comment in

  • Semaphorin breaks symmetry.
    Howell AS, Shen K. Howell AS, et al. Neuron. 2011 Aug 11;71(3):381-2. doi: 10.1016/j.neuron.2011.07.020. Neuron. 2011. PMID: 21835334 Free PMC article.

Similar articles

Cited by

References

    1. Adler CE, Fetter RD, Bargmann CI. UNC-6/Netrin induces neuronal asymmetry and defines the site of axon formation. Nat Neurosci. 2006;9:511–518. - PMC - PubMed
    1. Arimura N, Kaibuchi K. Neuronal polarity: from extracellular signals to intracellular mechanisms. Nat. Rev. Neurosci. 2007;8:194–205. - PubMed
    1. Baas PW, Deitch JS, Black MM, Banker GA. Polarity orientation of microtubules in hippocampal neurons: uniformity in the axon and nonuniformity in the dendrite. Proc. Natl Acad. Sci. USA. 1988;85:8335–8339. - PMC - PubMed
    1. Barnes AP, Lilley BN, Pan YA, Plummer LJ, Powell AW, Raines AN, Sanes JR, Polleux F. LKB1 and SAD kinases define a pathway required for the polarization of cortical neurons. Cell. 2007;129:549–563. - PubMed
    1. Barnes AP, Solecki D, Polleux F. New insights into the molecular mechanisms specifying neuronal polarity in vivo. Curr. Opin. Neurobiol. 2008;18:44–52. - PMC - PubMed

Publication types

MeSH terms

LinkOut - more resources