Comparative Study
. 2011 Aug 11;71(3):555-64.
doi: 10.1016/j.neuron.2011.05.047.

Single-trial neural correlates of arm movement preparation

Affiliations
Comparative Study

Single-trial neural correlates of arm movement preparation

Afsheen Afshar et al. Neuron. .

Abstract

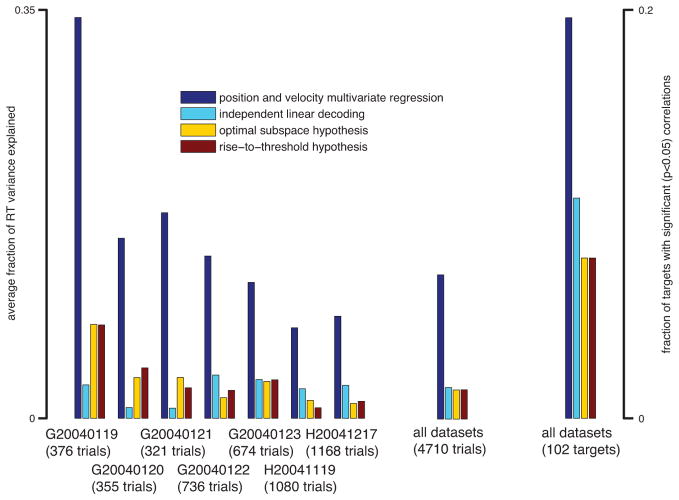
The process by which neural circuitry in the brain plans and executes movements is not well understood. Until recently, most available data were limited either to single-neuron electrophysiological recordings or to measures of aggregate field or metabolism. Neither approach reveals how individual neurons' activities are coordinated within the population, and thus inferences about how the neural circuit forms a motor plan for an upcoming movement have been indirect. Here we build on recent advances in the measurement and description of population activity to frame and test an "initial condition hypothesis" of arm movement preparation and initiation. This hypothesis leads to a model in which the timing of movements may be predicted on each trial using neurons' moment-by-moment firing rates and rates of change of those rates. Using simultaneous microelectrode array recordings from premotor cortex of monkeys performing delayed-reach movements, we compare such single-trial predictions to those of other theories. We show that our model can explain approximately 4-fold more arm-movement reaction-time variance than the best alternative method. Thus, the initial condition hypothesis elucidates a view of the relationship between single-trial preparatory neural population dynamics and single-trial behavior.


Figures

Figure 1
Figure 1
Illustrations of the optimal subspace hypothesis (A), the elaborated optimal subspace hypothesis (B), and the initial condition hypothesis discussed in this work (C). (A) The configuration of firing rates is represented in a state space, with the firing rate of each neuron contributing an axis, only three of which are drawn here. Under this hypothesis the goal of motor preparation is to optimize the configuration of firing rates so that it lies within the optimal subregion for the desired movement (small gray region with green outline). The formation of a motor plan for a given trial is represented by an individual gray trace. Adapted from Churchland et al. (2006c). (B) The hypothesis extended to include the entire trial. The across-trial variance, represented in this illustration by the area of the colored ellipses, reduces from target onset (red) to go cue (green) to movement onset (blue). Bold dots represent individual trials at target onset, go cue, and movement onset. Pgo marks the neural state of a particular trial at the time of the go cue. Adapted from Yu et al. (2009) and Churchland et al. (2010). (C) In this work, we hypothesize that if the neural state on a given trial was far along the mean neural trajectory across all trials to that target, then that trial would have a short reaction time. This is possible due to the neural activity being closer to a movement threshold (dashed line). This corresponds to a given trial’s RT correlating with α (length of bold line segment), which is the projection of Pgo along p go+Δt. Vector Pgo connects the mean neural activity at the go cue across all trials to a given target (green asterisk) to the neural activity measured at the go cue on a given trial. Vector P go+Δt connects the mean neural activity at the go cue across all trials to a given target (green asterisk) to the mean neural activity at some offset after the go cue (Δt=100ms; see Fig. S1B). Bold line is the mean neural trajectory. Colored asterisks are the mean neural state across all trials at target onset, go cue, and movement onset.
Figure 2
Figure 2
Task design and neural data. (A) Monkeys performed a delayed-reach task, similar to that described previously Santhanam et al. (2006) and Churchland et al. (2006c) while simultaneous neural data were recorded via a 96-channel microelectrode array (Blackrock Microsystems, Salt Lake City, Utah). (B) One of 53 trials to a given target (G20040123, target 5, which is at a distance of 60mm and angle 225°). Gray corresponds to the baseline period (before a target is presented), red to the delay period (after target presentation but before go cue), green to the reaction time period (after go cue but before movement onset), and blue to movement period (after recorded movement onset). A spike raster is shown, which is organized with one neuron per row and with each tick corresponding to a spike time for a given neuron. Neurons are organized by preferred direction as determined by plan period activity. Hand and eye traces are also shown.
Figure 3
Figure 3
Low-D representations of recorded neural data and correlations of single-trial RT predictions with RT. GPFA reductions of neural data recorded for three randomly selected (A) and for all 49 (B) preparations and movement initiations to the same target (G20040123, target 13, which is at a distance of 100mm and angle 45°). Same color code is used here as in the previous figure. The neural state at the time of target onset are bold red dots; at the time of the go cue are bold green dots; at the time of measured movement onset are bold blue dots. Lighter dots are separated by 20ms. (C) Normalized path neural speed in GPFA space as a function of time relative to target onset. Same color code used here as in previous figures. Dark black trace is the mean speed across all trials. Note that this speed increases after target onset and decreases to near zero until the go cue (green portion of traces). (D) Histograms of correlations coefficients of neural metric described in Fig. 1C with Δt = 100ms across all reach targets performed by two monkeys (G and H). The medians of both distributions (marked with arrows) are not 0 with p<0.01 (Wilcoxon sign-rank test). Colored bars represent those correlations that are statistically significant (p<0.05).
Figure 4
Figure 4
Illustration depicting neural velocity correlate (A) and resulting histogram of cor- relation coefficients when using neural velocity to predict RT for all targets by two monkeys (B). (A) Neural velocity at time t, labeled vt, was defined as (the neural position at t+10ms − position at t − 10ms). The component of the vgo along the mean neural trajectory across trials was correlated with that trial’s RT. (B) Histogram of correlation coefficients from all comparisons of projections of neural velocity with trial-by-trial RT for monkeys G and H when segregating by delay period in 100ms bins. Medians are denoted by arrows and gray bars represent significant correlations (p<0.05). The medians of both distributions (marked with arrows) are not 0 with p<0.01 (Wilcoxon sign-rank test).
Figure 5
Figure 5
Bar graph comparing full multivariate model of RT with other models by dataset and overall. On right is a bar graph of the fraction of targets that had a significant correlation (p<0.05) between the given neural metrics and RT.

Comment in

Similar articles

Cited by

References

    1. Bastian A, Schoner G, Riehle A. Preshaping and continuous evolution of motor cortical representations during movement preparation. Eur J Neurosci. 2003;18:2047–2058. - PubMed
    1. Churchland MM, Afshar A, Shenoy KV. A central source of movement variability. Neuron. 2006a;52:1085–1096. - PMC - PubMed
    1. Churchland MM, Cunningham JP, Kaufman MT, Ryu SI, Shenoy KV. Cortical preparatory activity: Representation of movement or first cog in a dynamical machine? Neuron. 2010a;68:387–400. - PMC - PubMed
    1. Churchland MM, Santhanam G, Shenoy KV. Preparatory activity in premotor and motor cortex reflects the speed of the upcoming reach. Journal of Neurophysiology. 2006b;96:3130–3146. - PubMed
    1. Churchland MM, Shenoy KV. Delay of movement caused by disruption of cortical preparatory activity. J Neurophysiol. 2007a;97:348–359. - PubMed

Publication types

LinkOut - more resources