. 2011 Nov;39(21):9139-54.
doi: 10.1093/nar/gkr573. Epub 2011 Aug 10.

From crystal and NMR structures, footprints and cryo-electron-micrographs to large and soft structures: nanoscale modeling of the nucleosomal stem

Affiliations

From crystal and NMR structures, footprints and cryo-electron-micrographs to large and soft structures: nanoscale modeling of the nucleosomal stem

Sam Meyer et al. Nucleic Acids Res. 2011 Nov.

Abstract

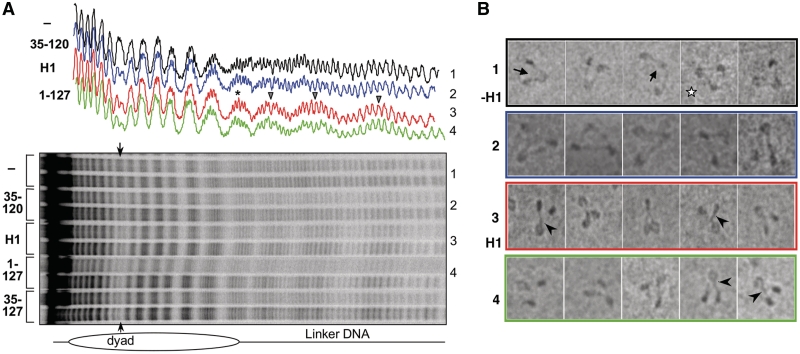
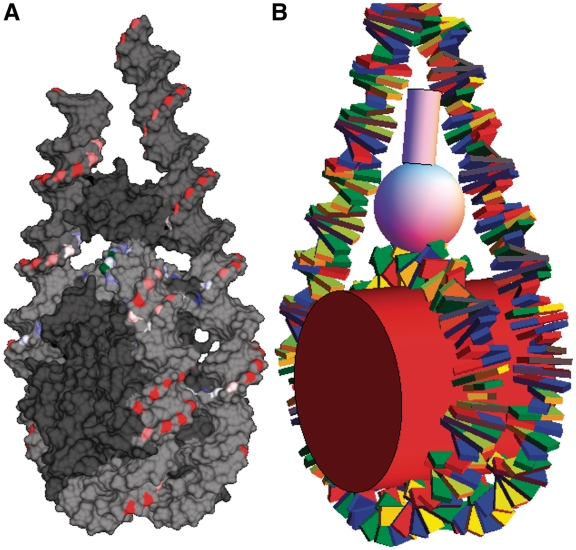
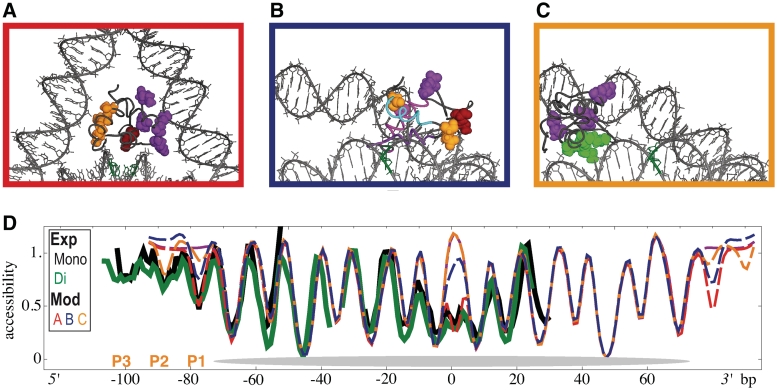
The interaction of histone H1 with linker DNA results in the formation of the nucleosomal stem structure, with considerable influence on chromatin organization. In a recent paper [Syed,S.H., Goutte-Gattat,D., Becker,N., Meyer,S., Shukla,M.S., Hayes,J.J., Everaers,R., Angelov,D., Bednar,J. and Dimitrov,S. (2010) Single-base resolution mapping of H1-nucleosome interactions and 3D organization of the nucleosome. Proc. Natl Acad. Sci. USA, 107, 9620-9625], we published results of biochemical footprinting and cryo-electron-micrographs of reconstituted mono-, di- and tri-nucleosomes, for H1 variants with different lengths of the cationic C-terminus. Here, we present a detailed account of the analysis of the experimental data and we include thermal fluctuations into our nano-scale model of the stem structure. By combining (i) crystal and NMR structures of the nucleosome core particle and H1, (ii) the known nano-scale structure and elasticity of DNA, (iii) footprinting information on the location of protected sites on the DNA backbone and (iv) cryo-electron micrographs of reconstituted tri-nucleosomes, we arrive at a description of a polymorphic, hierarchically organized stem with a typical length of 20 ± 2 base pairs. A comparison to linker conformations inferred for poly-601 fibers with different linker lengths suggests, that intra-stem interactions stabilize and facilitate the formation of dense chromatin fibers.


Figures

Figure 1.
Figure 1.
Illustration of the available data from (23). (A) •OH-footprinting gels of mononucleosomes in the linker region, and corresponding intensity profiles: (1) without H1, (2) truncated mutant 35-120 of H1 (gH1), (3) full H1, (4) truncated mutant 1-127. The dyad region is protected by all H1 mutants, as well as the first 10 bps of the linker. Full H1 and mutant 1-127 exhibit further periodic protections on the linker. (B) CEMs of trinucleosomes: (1) without H1, (2) gH1, (3) H1, (4) 1-127 mutant of H1. Arrowheads indicate visible stems, the star indicates a shape incompatible with the presence of a stem.
Figure 2.
Figure 2.
Post-processing of the footprinting gels. Upper panels: available raw data for di- and mononucleosomes. Intensity variations in parts of the traces (see window in the inset, right panel) allow the resolution of bands corresponding to strands with a specific length. Outside these windows, one can only discern an oscillation with the 10 bp helical period of DNA. The key step in the quantitative analysis of the gels is the identification of individual bands, i.e. the mapping from pixels to base pairs (see details in the Supplementary Data). Middle panels: intensity per base pair, obtained by the integration of the raw signal over the bp width. Bottom panels: relative accessibilities: the intensity per base pair is rescaled by the maxima in a moving window (of 7–20 bp width). The resulting signal represents the relative accessibility of a site compared to its neighbors (in the same trace). Left hand-side: H1-bound dinucleosome traces in the NCP dyad region—red, green, blue—from the same gel, with different •OH concentrations; black: complementary strand, from another gel. The consistency of the resulting signals (from independent traces with different relative noise) shows the robustness of the procedure (maximum difference ~0.1). However, this signal does not represent the absolute accessibility, so that the amplitudes of different traces (or regions) cannot be directly compared (see text). Right hand-side: available mononucleosome traces in the linker region: -H1 (black), gH1 (green), +H1 (purple); the signals are shown in the resolved region where individual bands could be identified for the three signals (see window in the inset): only one available trace for each. For a non-oscillating signal (in particular, the left end of the -H1 black trace), the last step effectively amplifies pure noise. We therefore excluded from the subsequent analysis the data for which this effect prevents any reliable interpretation.
Figure 3.
Figure 3.
Structural models used in the modeling of DNA and histones, and for the computation of structure-derived accessibility patterns. (A) Atomistic model (for the placement of gH1). NCP components from the crystal structure (7), NMR linker histone structure (37), and straight or bent linker B-DNA pseudo-atomic coordinates (40). (B) Coarse-grained model (for the modeling of the stem). Rigid base pair model of DNA (38), with NCP structure obtained from (A). The histones are modeled as cylinders (core octamer and H1 tail) and spheres (gH1).
Figure 4.
Figure 4.
(A) Relative accessibility as obtained from the processing of the gels: mononucleosome without H1 (black), with gH1 (green), with H1 (purple) and dinucleosome with H1 (red). The position of the NCP is indicated by a gray ellipse, and the protected sites P1–P4 are indicated in orange. The correspondance with the color-coding scheme used on (B)–(D) is shown on the left. On the linker DNA, the protection is weaker than on the NCP, so that protected sites appear white rather than blue. (B) Model of the nucleosomal DNA without H1 (-H1) with color-coding of the C5′ atoms from blue (protected) to red (accessible). C5′ atoms without footprinting data and all other DNA are shown in gray, and the dyad is indicated in green. View from the NCP superhelical axis. The protected sites are facing the histone octamer, validating the quantitative positioning of the protection trace. The co-localization of the protected sites from both strands supports the symmetry hypothesis. (C) Same for gH1-bound nucleosomal DNA, shown with straight linker DNA. New protections can be identified in the dyad region (C5′ atoms facing outside the NCP), and on the first turn of the linker DNA. (D) Same for H1-bound nucleosomal DNA, with straight linker DNA arms of length 38 bp, exhibiting additional protection on the linker (white spots).
Figure 5.
Figure 5.
Comparison of the experimentally observed protection in the presence of gH1 with relative accessibilities calculated from three different structural models for the location of the globular domain: (A) Three-contact nucleosome configuration by Fan et al. (24). The viewing direction is the superhelical axis. See ‘Materials and Methods’ section for details. (B) Two-contact nucleosome configuration proposed by Zhou et al. (25). Contact is established with core DNA at 1–4 bp from the dyad, and with one DNA linker (the other linker is not shown). The viewing direction is the superhelical axis. (C) Two-contact nucleosome configuration by Brown et al. (26). Contact is established about 5 bp away from the dyad, and with one linker DNA. (D) Experimentally observed protection: thick solid lines: black (mononucleosome), green (dinucleosome). Structure-derived accessibilities: dashed lines: red (three-contact, A), blue [two-contact by Zhou et al. (25), B] and orange [two-contact by Brown et al. (26), C], and based on a pure mononucleosome without H1 (magenta) [data already published in (23)]. The predictions differ in the protection at the dyad where the two-contact models show no or very weak protection, and at the entry/exit linkers. The measured relative accessibility for a gH1-bound mononucleosome is shown in black, and that of a gH1-bound dinucleosome is shown in green.
Figure 6.
Figure 6.
Nanoscale modeling of the stem (A) H1-protection color-coded nucleosomes with straight linkers (left) and two geometrical stem models. For both of them, protected sites (white spots on the linker) do not face each other. These models do not account for the observed protection pattern. (B) To determine the most likely stem structure compatible with the observed protection pattern, we minimized the DNA nanoscale elastic energy under the constraint that the most protected sites face each other. The initial configuration of the relaxation is illustrated here, with straight linkers. 4 springs (black cylinders) enforce contact between the protected sites. Only C5′ atoms were depicted, color-coded according to the experimental protection pattern (gray when no signal). The green sphere represents the dyad. Views from the NCP superhelical axis and perpendicular. (C) Stem structure obtained as a result of the relaxation [already shown in (23)]. Views in direction of the superhelical axis and 30 apart (dark gray histones, light blue histone tail with arbitrary conformation). The DNA is colored in blue within possible extension of the truncated H1 tail.
Figure 7.
Figure 7.
Left hand-side: comparison of the (coarse-grain) model-derived ensemble-averaged relative accessibility (solid line) with the corresponding experimental relative accessibility (dotted line). The green bars indicate the rigid part. Vertical orange dotted lines are the maximally protected sites in the experimental data. Right hand-side: superposition of 40 snapshots of the fluctuating linkers (vertical orange dotted lines: same as on the left hand-side). (A) -H1 ensemble; (B) gH1 ensemble; (C)–(E) H1 ensembles with 16, 20, 24 bp kept rigid, respectively. As expected by construction, the most rigid stem model (24 rigid bp) reproduces the observed pattern. The apparent effect of the fluctuations is to weaken the mean protection, so that the protection of the 2 external sites (P3, P4) fades in the softest ensemble (16 rigid bp). (F) Rigid fully-protected stem structure. Left: additional dashed line: atomistic structure-derived accessibility. Right: Molecular model of the rigid stem, with DNA shown gray, color-coded protected sites (see Figure 4), gH1 shown black, H1 tail shown yellow (arbitrary conformation) and DNA within possible extension of the truncated H1 tail shown blue.
Figure 8.
Figure 8.
Comparison of CEM trinucleosome pictures and model-derived trinucleosome snapshots, chosen randomly and appropriately projected. Images with five typical shapes of trinucleosomes were colored: from red (open structure) to blue (joined linkers). (A) Experimental and model trinucleosomes chosen in the -H1 ensemble. (B) Same in the gH1 ensemble. (C) Experimental and model trinucleosomes chosen in the H1 ensembles, with rigid parts of indicated lengths (softer 16 bp, 20 bp, most rigid 24 bp). (D) Repartition of trinucleosome shapes (indicated by colors) in the experimental C-EMs and the pictures from the model trinucleosome ensembles. Pictures which coud not be assigned a color appear gray. Only the two softer models can account for the most open conformations observed in the pictures. These observations together with Figure 7 suggest a typical rigidity extension of ~20 linker bp, accounting for both exprimental data. Experimental data already published in (23).
Figure 9.
Figure 9.
Comparison of our mono-nucleosome stem structures to the inferred (59) linker conformations in model chromatin fibers reconstituted from poly-601 templates (35). View along the superhelical axis (top) and perpendicular (bottom). For the fiber conformations, only the first half of both linkers is shown. (A) Wong et al. (59) most favorable structures for linker length 30, 40, 50 and 60 bp (from left to right), corresponding to a fiber diameter of 35 nm. Picture courtesy of Julien Mozziconacci. (B) Ground state of the mono-nucleosome stem: the root and trunk are those of the fully-protected structure, and the flexible crown or outer stem (shown in brighter colors) is straight. (C) Wong et al. (59) most favorable structures for linker length 70, 80, 90 (from left to right), corresponding to a fiber diameter of 45 nm. The black dot indicates the dyad. Original pictures were not available: the linker conformations were rebuilt approximately, by hand, from the available data provided by Wong et al. (59). For all but the shortest linkers (30 bp), the root part is approximately conserved among the structures, allowing for a common three-contact asymmetrical binding mechanism of gH1. Longer linkers (50 bp and beyond) adopt a conformation compatible with the formation of a trunk and additional stabilization by the H1 tail.

Similar articles

Cited by

References

    1. Ball P. Portrait of a molecule. Nature. 2003;421:421–422. - PubMed
    1. Kornberg RD. Structure of chromatin. Annu. Rev. Biochem. 1997;46:931–954. 1977. - PubMed
    1. Kornberg RD. Chromatin structure: a repeating unit of histones and DNA. Science. 1974;184:868–871. - PubMed
    1. Van Holde KE. Chromatin. New York: Springer; 1989.
    1. Luger K, Mader AW, Richmond RK, Sargent DF, Richmond TJ. Crystal structure of the nucleosome core particle at 2.8 a resolution. Nature. 1997;389:251–260. - PubMed

Publication types