. 2011 Oct;85(20):10518-28.
doi: 10.1128/JVI.00655-11. Epub 2011 Aug 10.

Fitness costs and diversity of the cytotoxic T lymphocyte (CTL) response determine the rate of CTL escape during acute and chronic phases of HIV infection

Affiliations

Fitness costs and diversity of the cytotoxic T lymphocyte (CTL) response determine the rate of CTL escape during acute and chronic phases of HIV infection

Vitaly V Ganusov et al. J Virol. 2011 Oct.

Abstract

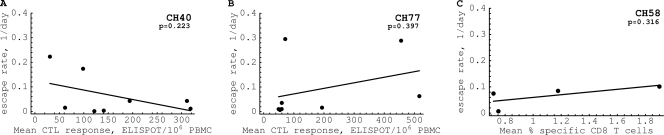
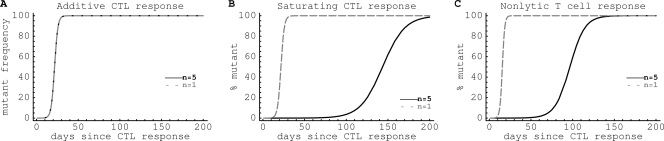
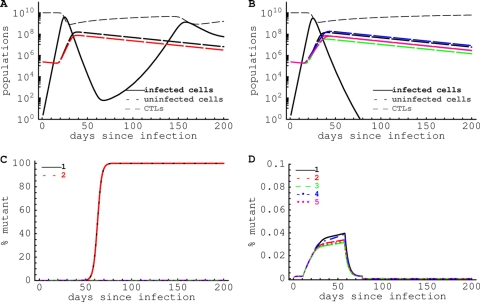
HIV-1 often evades cytotoxic T cell (CTL) responses by generating variants that are not recognized by CTLs. We used single-genome amplification and sequencing of complete HIV genomes to identify longitudinal changes in the transmitted/founder virus from the establishment of infection to the viral set point at 1 year after the infection. We found that the rate of viral escape from CTL responses in a given patient decreases dramatically from acute infection to the viral set point. Using a novel mathematical model that tracks the dynamics of viral escape at multiple epitopes, we show that a number of factors could potentially contribute to a slower escape in the chronic phase of infection, such as a decreased magnitude of epitope-specific CTL responses, an increased fitness cost of escape mutations, or an increased diversity of the CTL response. In the model, an increase in the number of epitope-specific CTL responses can reduce the rate of viral escape from a given epitope-specific CTL response, particularly if CD8+ T cells compete for killing of infected cells or control virus replication nonlytically. Our mathematical framework of viral escape from multiple CTL responses can be used to predict the breadth and magnitude of HIV-specific CTL responses that need to be induced by vaccination to reduce (or even prevent) viral escape following HIV infection.


Figures

Fig. 1.
Fig. 1.
A cartoon of viral escape from a single CTL response and parameters calculated to characterize the escape. The slope of the change of the frequency of the escape variant at frequency f = 50% is proportional to the viral escape rate ε, and the time by which the variant reaches 50% in the viral population (t50) is determined by the initial frequency of the viral variant f0 and the rate of viral escape ε.
Fig. 2.
Fig. 2.
The dynamics of viral escape from epitope-specific CTL responses in the acute and chronic phases of HIV infection. Points represent the percentages of given escape variants at different times after the onset of symptoms and lines represent the best fit of the model given in equation 4 to these data. We show only a selected set of data and model fits for clarity; a complete analysis for these three patients is given in Fig. S6 to S8, and the estimates of escape rates with calculated confidence intervals are given in Tables S1 to S3, in the supplemental material. Each mutation is labeled according to the peptide corresponding to the sequence in which the mutation occurred (41).
Fig. 3.
Fig. 3.
Distribution of escape rates as a function of time since the onset of symptoms. For each escape variant, we calculate t50, the time at which the escape mutant is predicted to reach a frequency of 50% in the virus population (see Fig. 1 in Materials and Methods). The decline of the escape rate with time was highly significant in every patient (P values are indicated on the panels).
Fig. 4.
Fig. 4.
Killing mediated by HIV-specific CTL responses and the cost of escape determine the sequence and the speed of CTL escapes during infection. We simulated the dynamics of HIV escape from multiple CTL responses using equations 5 and 6 (see Materials and Methods). On the plots, we show the changes in the percentages of variants that have escaped recognition of the first (solid line), second (small dashed line), and third (large dashed line) CTL responses over time. The model demonstrates that if there are three CTL responses from which the virus can escape, with everything else being equal, the first escape occurs from the strongest immune response (k1 = 0.3 day−1), and the last escape is from the weakest CTL response (k3 = 0.05 day−1) (A). Similarly, if the CTL-mediated pressure is similar for all epitopes, the first escape to occur is in the epitope that induces the lowest fitness cost (c1 = 0), and late escapes are those that incur the highest fitness cost (c3 = 0.20) (B). In both cases, early escapes occur at a higher rate than late escapes (A and B). In panel A, c1 = c2 = c3 = 0.005; k1 = 0.3 day−1, k2 = 0.1 day−1, and k3 = 0.05 day−1. In panel B, k1 = k2 = k3 = 0.3 day−1; c1 = 0, c2 = 0.13, and c3 = 0.20. Other parameters for both panels are as follows: r = 1.5 day−1; δ = 0.5 day−1. Mutants are assumed to be present when selection begins at frequencies μj, where μ = 2 × 10⁻⁵ and j is the number of mutated epitopes (e.g., m0,0,0 = μ0 = 1). As predicted by a simple model, the rate of escape from the ith CTL response is given by the difference kicir (see equation 3). Results were quantitatively similar if we explicitly included the dynamics of target cells in the model or modeled generation of escape variants from the founder virus by mutations (results not shown).
Fig. 5.
Fig. 5.
The absence of a significant correlation between the rate of HIV escape from a given epitope-specific CTL response and the average magnitude of the response in three patients, CH40 (A), CH77 (B), and CH58 (C). It is expected that CTL responses of a larger magnitude should select for more-rapid escapes. This is not observed for several measures of the CTL response, such as the mean response (shown in the figure), where the mean is calculated over the whole observation period, the maximal response (maximal value of the response over the whole observation period), or the total response (sum of all measurements of the epitope-specific response; results not shown). Furthermore, no significant positive correlation was observed between the rate of escape and the average CTL response prior to viral escape. The lack of a correlation could have arisen because only a limited number of responses and patients have been analyzed.
Fig. 6.
Fig. 6.
Stronger and more diverse CD8+ T cell responses can slow down the appearance of escape variants in the case of a saturating CTL or nonlytic CD8+ T cell response. We model escape of the virus from the T cell response using the model shown in Materials and Methods (equations 5 and 6), assuming that CTL responses are additive (A) [k = 0.5 day−1 and k = (0.5, 0.2, 0.1, 0.05, 0.01) day−1 for n = 1 and n = 5, respectively], CTL responses are saturating (B) k = 0.5 day−1 and k = (0.08, 0.12, 0.12, 0.12, 0.05) day−1 for n = 1 and n = 5, respectively; the death rate of infected cells due to CTL response is 0.5 day−1], or CD8+ T cells control viral replication nonlytically (C) [k = 0.3 day−1 and k = (0.3, 0.5, 0.5, 0.5, 0.19) day−1 for n = 1 and n = 5, respectively; see also equations 9 and 10]. Other parameters are as follows: c = (0, 1, 1, 1, 1) (to allow for escape only in the first epitope); r = 3 day−1; and δ = 0.5 day−1. In all panels, escape from the first CD8+ T cell response is shown.
Fig. 7.
Fig. 7.
HIV-specific CD8+ T cell responses of a sufficient diversity can prevent viral escape in acute HIV infection. We model escape of the virus from the T cell response using the model given by equations 5 to 7, assuming that there are 2 (A and C) [ρ = (0.5, 0.45) day−1 and hE = (108, 108)] or 5 (B and D) [ρ = (0.5, 0.45, 0.4, 0.35, 0.3) day−1 and hE = (108, 108, 108, 107, 107)] HIV-specific CTL responses in the acute phase of the infection. Virus replication is limited by the availability of uninfected target cells, and the presence of the virus stimulates generation of the CTL response (A and B). Viral variants that escape recognition by a given CTL response are produced by mutation at the rate μ = 2 × 10⁻⁵ (C and D). Other parameters in simulations are as follows: s = 5 × 10³ cells/day; δE = 0.02 day−1; kE = 0.5 day−1; h = 107; and c = 0.05. When 5 CTL responses control HIV replication, escape is prevented because the advantage of a variant escaping from a single response is low, and the likelihood of generating a variant with 5 escape mutations is very small. We assume that if the number of cells infected with a particular viral variant drops below 1 in the simulations, that variant does not replicate.

References

    1. Addo M., et al. 2003. Comprehensive epitope analysis of human immunodeficiency virus type 1 (HIV-1)-specific T-cell responses directed against the entire expressed HIV-1 genome demonstrate broadly directed responses, but no correlation to viral load. J. Virol. 77:2081–2092 - PMC - PubMed
    1. Ahmed R. 1996. Tickling memory T cells. Science 272:1904. - PubMed
    1. Allen T., et al. 2004. Selection, transmission, and reversion of an antigen-processing cytotoxic T-lymphocyte escape mutation in human immunodeficiency virus type 1 infection. J. Virol. 78:7069–7078 - PMC - PubMed
    1. Allen T. M., et al. 2000. Tat-specific cytotoxic T lymphocytes select for SIV escape variants during resolution of primary viraemia. Nature 407:386–390 - PubMed
    1. Allen T. M., et al. 2005. De novo generation of escape variant-specific CD8+ T-cell responses following cytotoxic T-lymphocyte escape in chronic human immunodeficiency virus type 1 infection. J. Virol. 79:12952–12960 - PMC - PubMed

Publication types

Substances