

doi: 10.1093/biostatistics/kxr019.
Epub 2011 Aug 10.
Inference for discretely observed stochastic kinetic networks with applications to epidemic modeling
Affiliations
- PMID: 21835814
- PMCID: PMC3276272
- DOI: 10.1093/biostatistics/kxr019
Item in Clipboard
Inference for discretely observed stochastic kinetic networks with applications to epidemic modeling
Biostatistics.
2012 Jan.
Abstract
We present a new method for Bayesian Markov Chain Monte Carlo-based inference in certain types of stochastic models, suitable for modeling noisy epidemic data. We apply the so-called uniformization representation of a Markov process, in order to efficiently generate appropriate conditional distributions in the Gibbs sampler algorithm. The approach is shown to work well in various data-poor settings, that is, when only partial information about the epidemic process is available, as illustrated on the synthetic data from SIR-type epidemics and the Center for Disease Control and Prevention data from the onset of the H1N1 pandemic in the United States.
Figures
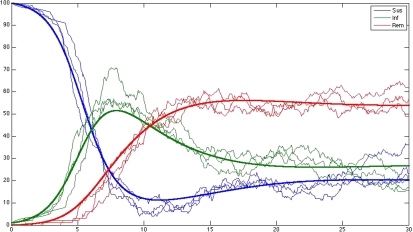
ODE and SKN trajectories for SIRS model species (susceptibles, infectives, and removed, respectively, top, middle, and bottom curve at the origin) with total population size M = 100.
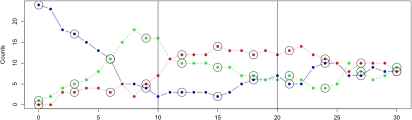
Datapoints along the trajectories for susceptibles, infectives, and removed (top, middle, and bottom curve at the origin, respectively) in the SIRS model. Vertical lines indicate the data batches used for the 3 first dense grid scenarios (m = 1) reported on in Table 1. Circled values mark the data set used in fourth (sparse grid) scenario when m = 3.
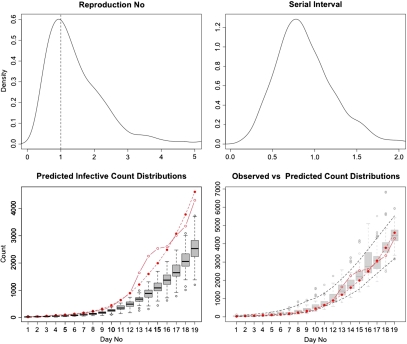
Results of the H1N1 model analysis. Top panel left: the posterior distribution of the reproduction number R0 = θ1/θ2. Top panel right: the posterior distribution of θ3 or the rate of conversion from “latent” to “symptomatic” infectives (the serial interval). Bottom panel left: model predicted posterior cross-sectional distributions of the time-specific counts of “latent” infectives (bar plots) along with observed and smoothed counts (bullets) of H1N1 cases in the continental United States during the onset of the epidemic. Bottom panel right: goodness of fit analysis. The comparison of the observed data with the model predicted 95% posterior credibility bounds (dashed lines) along with the cross-sectional distributions of the observed counts generated from the model with estimated parameters.
Similar articles
-
Capturing the time-varying drivers of an epidemic using stochastic dynamical systems.Biostatistics. 2013 Jul;14(3):541-55. doi: 10.1093/biostatistics/kxs052. Epub 2013 Jan 4. Biostatistics. 2013. PMID: 23292757
-
Bayesian inference for stochastic multitype epidemics in structured populations using sample data.Biostatistics. 2009 Oct;10(4):779-91. doi: 10.1093/biostatistics/kxp031. Epub 2009 Jul 31. Biostatistics. 2009. PMID: 19648227
-
Bayesian model choice for epidemic models with two levels of mixing.Biostatistics. 2014 Jan;15(1):46-59. doi: 10.1093/biostatistics/kxt023. Epub 2013 Jul 24. Biostatistics. 2014. PMID: 23887980
-
Modelling under-reporting in epidemics.J Math Biol. 2014 Sep;69(3):737-65. doi: 10.1007/s00285-013-0717-z. Epub 2013 Aug 13. J Math Biol. 2014. PMID: 23942791
-
Phylogenetic and epidemic modeling of rapidly evolving infectious diseases.Infect Genet Evol. 2011 Dec;11(8):1825-41. doi: 10.1016/j.meegid.2011.08.005. Epub 2011 Aug 31. Infect Genet Evol. 2011. PMID: 21906695 Free PMC article. Review.
Cited by
-
Network reconstruction from infection cascades.J R Soc Interface. 2019 Feb 28;16(151):20180844. doi: 10.1098/rsif.2018.0844. J R Soc Interface. 2019. PMID: 30958195 Free PMC article.
-
The multilevel hierarchical data EM-algorithm. Applications to discrete-time Markov chain epidemic models.Heliyon. 2022 Dec 22;8(12):e12622. doi: 10.1016/j.heliyon.2022.e12622. eCollection 2022 Dec. Heliyon. 2022. PMID: 36643325 Free PMC article.
-
Comparison of Parameter Estimation Methods in Stochastic Chemical Kinetic Models: Examples in Systems Biology.AIChE J. 2014 Apr;60(4):1253-1268. doi: 10.1002/aic.14409. Epub 2014 Mar 5. AIChE J. 2014. PMID: 27429455 Free PMC article.
-
Survival dynamical systems: individual-level survival analysis from population-level epidemic models.Interface Focus. 2020 Feb 6;10(1):20190048. doi: 10.1098/rsfs.2019.0048. Epub 2019 Dec 13. Interface Focus. 2020. PMID: 31897290 Free PMC article.
-
COVID-19: Estimation of the transmission dynamics in Spain using a stochastic simulator and black-box optimization techniques.Comput Methods Programs Biomed. 2021 Nov;211:106399. doi: 10.1016/j.cmpb.2021.106399. Epub 2021 Sep 6. Comput Methods Programs Biomed. 2021. PMID: 34607036 Free PMC article.
References
-
- Andersson H, Britton T. Stochastic Epidemic Models and Their Statistical Analysis. New York: Springer; 2000a.
-
- Andersson H, Britton T. Stochastic epidemics in dynamic populations: quasi-stationarity and extinction. Journal of Mathematical Biology. 2000b;41:559–580. - PubMed
-
- Bellman R, Dreyfus S. Functional Approximations and Dynamic Programming. Mathematical Tables and Other Aids to Computation. 1959;13:247–251.
-
- Boys R, Giles P. Bayesian inference for stochastic epidemic models with time-inhomogeneous removal rates. Journal of Mathematical Biology. 2007;55:223–247. - PubMed
Publication types
MeSH terms
Grants and funding
LinkOut - more resources
Full Text Sources
