. 2011 Oct;25(10):1773-85.
doi: 10.1210/me.2011-0082. Epub 2011 Aug 11.

APPL1 mediates adiponectin-induced LKB1 cytosolic localization through the PP2A-PKCzeta signaling pathway

Affiliations

APPL1 mediates adiponectin-induced LKB1 cytosolic localization through the PP2A-PKCzeta signaling pathway

Sathyaseelan S Deepa et al. Mol Endocrinol. 2011 Oct.

Abstract

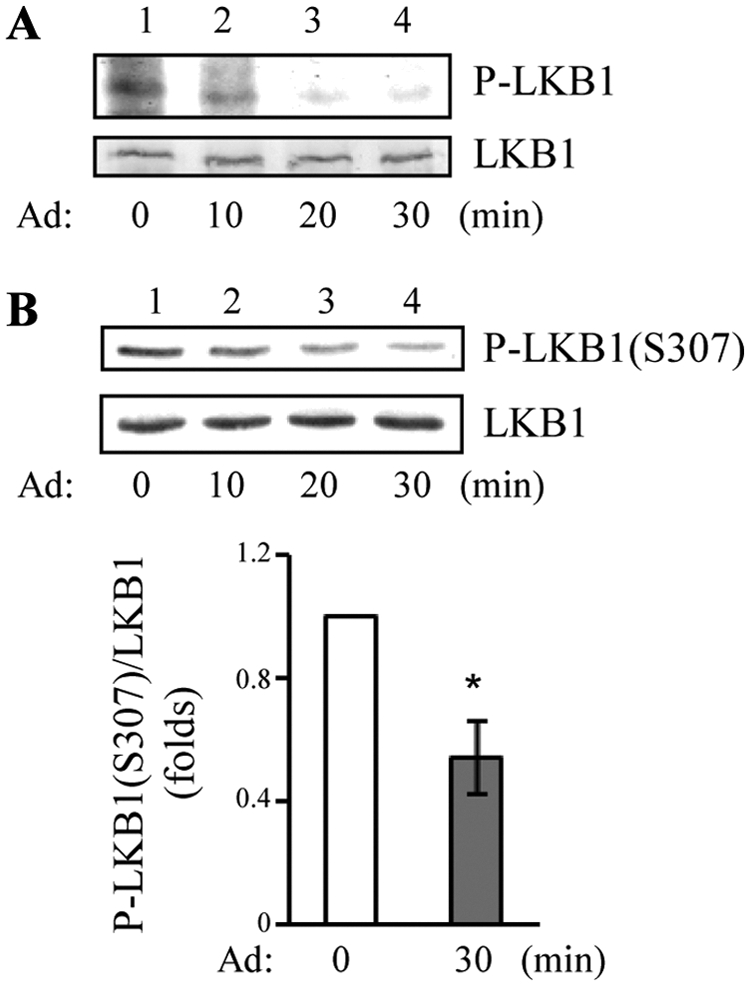
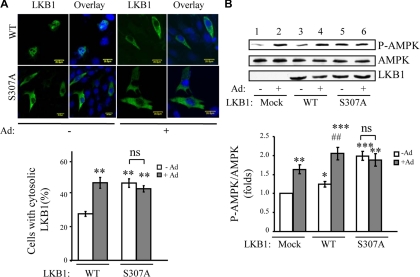
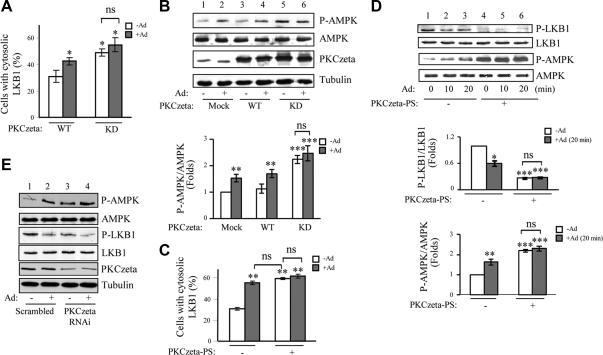
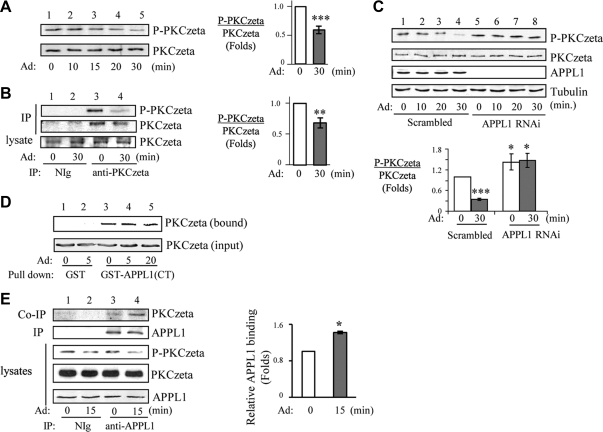
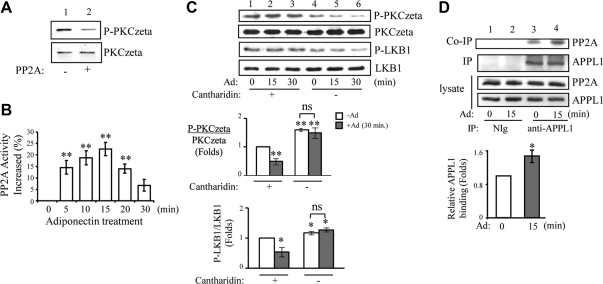
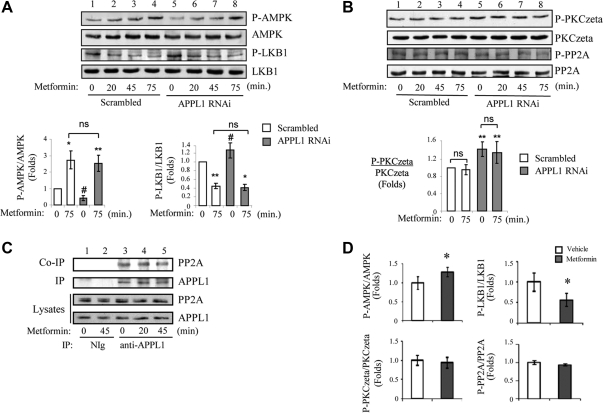
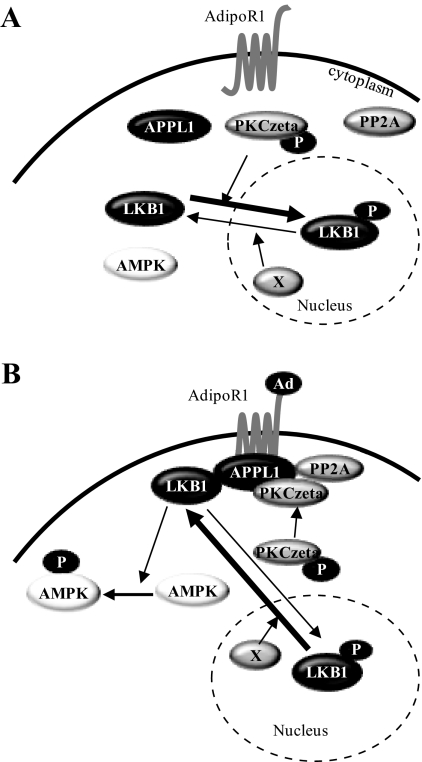
We recently found that the adaptor protein containing pleckstrin homology domain, phosphotyrosine binding domain and leucine zipper motif (APPL)1 is essential for mediating adiponectin signal to induce liver kinase B (LKB)1 cytosloic translocation, an essential step for activation of AMP-activated protein kinase (AMPK) in cells. However, the underlying molecular mechanisms remain unknown. Here, we demonstrate that treating C2C12 myotubes with adiponectin promoted APPL1 interaction with protein phosphatase 2A (PP2A) and protein kinase Cζ (PKCζ), leading to the activation of PP2A and subsequent dephosphorylation and inactivation of PKCζ. The adiponectin-induced inactivation of PKCζ results in dephosphorylation of LKB1 at Ser(307) and its subsequent translocation to the cytosol, where it stimulates AMPK activity. Interestingly, we found that metformin also induces LKB1 cytosolic translocation, but the stimulation is independent of APPL1 and the PP2A-PKCζ pathway. Together, our study uncovers a new mechanism underlying adiponectin-stimulated AMPK activation in muscle cells and shed light on potential targets for prevention and treatment of insulin resistance and its associated diseases.


Figures

Fig. 1.
Fig. 1.
Adiponectin (Ad) induces dephosphorylation of LKB1 at Ser307. A, LKB1 undergoes dephosphorylation in response to adiponectin stimulation. C2C12 myoblasts transiently expressing myc-tagged LKB1 were serum starved, incubated with Krebs-Ringer bicarbonate buffer containing 0.5 mCi of 32P orthophosphate for 4 h, and then treated with or without adiponectin (1 μg/ml) for indicated times. LKB1 was immunoprecipitated with anti-myc monoclonal antibody (second panel), and autoradiography was performed to detect LKB1 phosphorylation (P-LKB1, top panel). B, Adiponectin induces dephosphorylation of LKB1 at Ser307 in cells. After serum starvation, C2C12 myotubes were treated with adiponectin (1 μg/ml) for indicated times. The phosphorylation of endogenous LKB1 at Ser307 and the protein levels were detected by Western blot analysis with antibodies specific to phospho-LKB1-Ser307 [P-LKB1 (S307), top panel] and LKB1 (second panel), respectively. The relative phosphorylation level of LKB1 was shown as graphic representation. The error bars represent mean ± sem from three independent experiments. *, P < 0.05.
Fig. 2.
Fig. 2.
Dephosphorylation at Ser307 stimulates cytosolic localization of LKB1. A, Localization of S307A mutant of LKB1 in C2C12 cells. Confocal microscopy images depict the localization of myc-tagged wild-type (WT) and S307A mutant form of LKB1 overexpressed in C2C12 myoblasts treated with or without adiponectin (Ad) (1 μg/ml) for 20 min. The localization of LKB1 (green) was determined by an antibody to the myc-tag. The cell nuclei were stained with DAPI (blue). Scale bar, 20 μm. The cells with cytosolic LKB1 were counted, analyzed, and shown as graphic representation. The error bars represent mean ± sem from three independent experiments. **, P < 0.01 vs. wild-type LKB1 without adiponectin treatment. ns, Nonstatistical significance. B, The effect of S307A mutant of LKB1 on adiponectin-stimulated AMPK activation. C2C12 myoblasts overexpressing myc-tagged wild-type or S307A mutant of LKB1 were treated with or without adiponectin (1 μg/ml) for 20 min. The phosphorylation of AMPK (top panel), AMPK protein level (second panel), and myc-tagged LKB1 (third panel) were detected by Western blot analysis with specific antibodies as indicated. The relative phosphorylation level of AMPK was shown as graphic representation. The error bars represent mean ± sem from three independent experiments. *, **, ***: P < 0.05, P < 0.01, and P < 0.001, respectively, vs. mock transfection without adiponectin treatment. ##, P < 0.01 vs. LKB1 (WT) without adiponectin stimulation. ns, Nonsignificant difference in statistics.
Fig. 3.
Fig. 3.
Inactivation of PKCζ induces cytosolic translocation of LKB1 and subsequent AMPK activation. A, The kinase activity of PKCζ is inversely related to adiponectin (Ad)-induced LKB1 cytosolic translocation. Localization of hemagglutinin-tagged LKB1 coexpressed with myc-tagged wild type (WT) or kinase inactive mutant (KD) of PKCζ in C2C12 myoblasts with or without adiponectin treatment (1 μg/ml, 20 min) was determined by confocal microscopy images with specific antibodies to the tags as described in Materials and Methods. The cells with cytosolic LKB1 were counted, analyzed, and shown as graphic representation. The error bars represent mean ± sem from three independent experiments. *, P < 0.05 vs. wild-type LKB1 without adiponectin treatment. ns, Nonsignificant difference in statistics. B, The kinase inactive mutant of PKCζ increases basal AMPK phosphorylation. C2C12 myoblasts were transiently transfected with myc-tagged wild-type or kinase inactive mutant (KD) of PKCζ and treated with or without adiponectin (1 μg/ml, 20 min). The phosphorylation of AMPK (top panel), the protein levels of AMPK (second panel) and PKCζ (third panel), and β-tubulin loading control (fourth panel) were detected by Western blot analysis with specific antibodies as indicated. The relative phosphorylation level of AMPK was shown as graphic representation. The error bars represent mean ± sem from three independent experiments. ** and ***, P < 0.01 and P < 0.001, respectively, vs. mock transfection without adiponectin treatment. C, PS of PKCζ blocked adiponectin-induced LKB1 translocation. Localization of myc-tagged LKB1 in C2C12 myoblasts with or without PKCζ-PS pretreatment (10 μm, 1 h) and with or without adiponectin (1 μg/ml, 20 min) stimulation was determined by confocal microscopy images with specific antibodies to the tags as described in Materials and Methods. The cells with cytosolic LKB1 were counted, analyzed, and shown as graphic representation. The error bars represent mean ± sem from three independent experiments. **, P < 0.01 vs. PKCζ-PS negative control without adiponectin treatment. D, Inhibition of PKCζ using PKCζ-PS increases basal AMPK phosphorylation. C2C12 myotubes were pretreated with or without PKCζ-PS (10 μm, 1 h) and treated with or without adiponectin (1 μg/ml, 20 min). LKB1 phosphorylation at Ser307 (first panel), AMPK phosphorylation at Thr172 (third panel), and protein levels of LKB1 (second panel) and AMPK (fourth panel) were determined by Western blot analysis with specific antibodies as indicated. The relative phosphorylation levels of LKB1 and AMPK were shown as graphic representations. The error bars represent mean ± sem from three independent experiments. *, **, and ***, P < 0.05, P < 0.01, and P < 0.001, respectively, vs. PKCζ-PS negative control without adiponectin treatment. E, Suppression of endogenous PKCζ expression enhances basal AMPK phosphorylation. shRNA PKCζ-suppressed or the control C2C12 myotubes were treated with or without adiponectin (1 μg/ml) for 20 min. Thr172 phosphorylation of AMPK (first panel), protein levels of AMPK (second panel), phosphorylation of LKB1 at Ser307 (third panel), protein levels of LKB1 (fourth panel) and PKCζ (fifth panel), and tubulin loading control (bottom panel) were detected by Western blot analysis with specific antibodies as indicated.
Fig. 4.
Fig. 4.
Adiponectin (Ad) induces inactivation of PKCζ with APPL1-dependent manner. A, The effect of adiponectin on PKCζ activity. After serum starvation, C2C12 myotubes were treated with adiponectin (1 μg/ml) for indicated times. Phosphorylation and protein levels of endogenous PKCζ were detected by Western blot analysis with antibodies specific to phospho-PKCζ-Thr410 (top panel) and PKCζ (second panel), respectively. The relative phosphorylation level of PKCζ was shown as graphic representation. The error bars represent mean ± sem from three independent experiments. ***, P < 0.001. B, Adiponectin induces inactivation of PKCζ in primary skeletal muscle tissue. Mouse skeletal muscle tissue was treated without or with adiponectin (2.5 μg/ml) for 30 min, and endogenous PKCζ was immunoprecipitated with PKCζ antibody. Phosphorylation of PKCζ at Thr410 (top panel) and protein expression levels of PKCζ (second and third panels) were determined by Western blot analysis with specific antibodies as indicated. The relative PKCζ phosphorylation was shown as graphic representation. The error bars represent mean ± sem from three independent experiments. **, P < 0.01. C, Adiponectin-induced inactivation of PKCζ is dependent on APPL1. C2C12 myotubes stably expressing APPL1 shRNA or the scrambled shRNA were serum starved and treated with adiponectin (1 μg/ml) for indicated times. Phosphorylation of PKCζ at Thr410 (top panel), protein expression levels of PKCζ (second panel) and APPL1 (third panel), and tubulin loading control (fourth panel) were determined by Western blot analysis with specific antibodies as indicated. The relative PKCζ phosphorylation was shown as graphic representation. The error bars represent mean ± sem from four independent experiments. *** and *, P < 0.001 and P < 0.05, respectively, vs. the scramble control without adiponectin treatment. D, APPL1 interacts with PKCζ via its C terminus in vitro. C2C12 myoblasts overexpressing myc-tagged PKCζ were serum starved and treated with adiponectin (1 μg/ml) as indicated. The myc-tagged PKCζ was pulled down by GST or GST-APPL1(CT) fusion proteins. The bound PKCζ (top panel) and PKCζ expression control (input, second panel) were detected with anti-myc antibody. E, PKCζ interacts with APPL1 in cells. C2C12 myotubes were serum starved and treated with adiponectin (1 μg/ml) for 15 min. Endogenous APPL1 was immunoprecipitated (IP) with negative control immunoglobulin (NIg) or an anti-APPL1 antibody. Immunoprecipitated APPL1 (second panel), coimmunoprecipitated PKCζ (top panel), and its Thr410 phosphorylation (third panel) were detected with the antibodies as indicated. The endogenous protein levels of PKCζ (forth panel) and APPL1 (fifth panel) in cell lysates were determined with specific antibodies as indicated. The relative APPL1 binding with PKCζ was shown as graphic representation. The error bars represent mean ± sem from three independent experiments. *, P < 0.05.
Fig. 5.
Fig. 5.
PP2A inhibits PKCζ activity in response to adiponectin (Ad) stimulation. A, In vitro dephosphorylation assay. Recombinant PKCζ (50 ng) was incubated with 2 U of purified PP2A for 30 min at 30 C. After stopping the reaction, the phosphorylation at Thr410 (top panel) and the protein (bottom panel) levels of PKCζ were determined by Western blot analysis with specific antibodies as indicated. B, Adiponectin stimulates PP2A activity. C2C12 myotubes were treated with mock control or adiponectin (1 μg/ml) for different times as indicated. PP2A activity was measured as described in Materials and Methods. The PP2A activity in the cells treated with mock control was set as 100% (activity change is 0% as shown); the activity changes with adiponectin treatments were compared with the control. **, P < 0.01. C, Adiponectin-mediated dephosphorylation of LKB1 and PKCζ is inhibited by cantharidin. C2C12 myotubes were pretreated with or without cantharidin (1 μm, 2 h) and treated with or without adiponectin (1 μg/ml) for different times as indicated. PKCζ phosphorylation at Thr410 (first panel), LKB1 phosphorylation at Ser307 (third panel), and protein levels of PKCζ (second panel) and LKB1 (fourth panel) were determined by Western blot analysis with specific antibodies as indicated. The relative phosphorylation levels of PKCζ and LKB1 were shown as graphic representation. The error bars represent mean ± sem from three independent experiments. * and **, P < 0.05 and P < 0.01, respectively, vs. cantharidin treatment without adiponectin. ns, Nonsignificant difference in statistics. D, Adiponectin stimulates interaction of APPL1 with PP2A in cells. After serum starvation, C2C12 myotubes were treated with adiponectin (1 μg/ml) for 15 min. Endogenous APPL1 was immunoprecipitated with an antibody specific to APPL1. Immunoprecipitated APPL1 (second panel) and coimmunoprecipitated endogenous PP2A (top panel), protein expression level of APPL1 (bottom panel) and PP2A (third panel) in the cell lysates were detected with specific antibodies as indicated. The relative APPL1 binding was shown as graphic representation. The error bars represent mean ± sem from three independent experiments. **, P < 0.01.
Fig. 6.
Fig. 6.
Metformin-induced subcellular translocation of LKB1 is independent of APPL1-PP2A-PKCζ pathway. A, Metformin-mediated AMPK phosphorylation and LKB1 dephosphorylation are independent of APPL1. C2C12 scrambled control and APPL1 RNAi myotubes were serum starved and treated with metformin (500 μm) for indicated times. Phosphorylation levels of AMPK at Thr172 (top panel), LKB1 at Ser307 (third panel), and protein expression levels of AMPK (second panel) and LKB1 (fourth panel) were detected by Western blot analysis with specific antibodies as indicated. The relative phosphorylation levels of AMPK and LKB1 are shown as graphic representation. The error bars represent mean ± sem from three independent experiments. ** and *, P < 0.01 and P < 0.05, respectively, vs. the scramble control without metformin treatment. #, P < 0.05 vs. the scrambled control without metformine treatment. ns, Nonsignificant difference in statistics. B, Metformin treatment has no effect on the phosphorylation levels of PKCζ and PP2A. C2C12 scrambled control and APPL1 RNAi myotubes were serum starved and treated with metformin (500 μm) for indicated times. Phosphorylation levels of PKCζ at Thr410 (top panel), PP2A-Cα/β at Tyr307 (third panel), and protein expression levels of PKCζ (second panel) and PP2A (fourth panel) were detected by Western blot analysis with specific antibodies as indicated. The relative phosphorylation level of PKCζ is shown as graphic representation. The error bars represent mean ± sem from three independent experiments. **, P < 0.01 vs. the scramble control without metformin treatment. C, Metformin has no effect on APPL1-PP2A interaction. C2C12 myotubes were serum starved and treated with metformin (500 μm) for indicated times. Endogenous APPL1 was immunoprecipitated (IP) with negative control immunoglobulin (NIg) or an antibody specific to APPL1. Immunoprecipitated APPL1 (second panel) and coimmunoprecipitated PP2A (first panel) and protein expression levels of APPL1 (bottom panel) and PP2A (third panel) in cell lysates were detected with specific antibodies as indicated. D, Metformin treatment in db/db mice increases AMPK and decreases LKB1 (Ser307) phosphorylation but has no effect on PKCζ and PP2A phosphorylation in the skeletal muscle. Phosphorylation levels of AMPK at Thr172, LKB1 at Ser307, PKCζ at Thr410, PP2A-Cα/β at Tyr307, and protein expression levels of AMPK, LKB1, PKCζ, and PP2A in the skeletal muscle tissue homogenate from db/db mice administered with vehicle (n = 6) or metformin (150 mg/kg) (n = 6) were detected by Western blotting analysis. The relative phosphorylation levels of AMPK, LKB1, PKCζ, and PP2A are shown as graphic representation. The error bars represent mean ± sem. *, P < 0.05.
Fig. 7.
Fig. 7.
A model of adiponectin-induced subcellular translocation of LKB1 in muscle cells. A, Under basal conditions, PP2A is inactive and dissociated from APPL1, leading to activation of PKCζ in cytosol. The activated PKCζ phosphorylates LKB1 at Ser307, which promotes LKB1 transporting into the nuclei. B, Adiponectin stimulation induces recruitment of both PP2A and PKCζ onto APPL1, leading to activation of PP2A and subsequent dephosphorylation of PKCζ by PP2A. The inactivated PKCζ then results in less phosphorylation of LKB1 at Ser307 and an accumulation of LKB1 in the cytosol, which leads to the binding of LKB1 with APPL1 and activation of AMPK. A hypothetical nuclear phosphatase (X) may also contribute to LKB1 cytosolic translocation in response to adiponectin or metformin response. AdipoR, Adiponectin receptor.

References

    1. Scherer PE, Williams S, Fogliano M, Baldini G, Lodish HF. 1995. A novel serum protein similar to C1q, produced exclusively in adipocytes. J Biol Chem 270:26746–26749 - PubMed
    1. Kadowaki T, Yamauchi T. 2005. Adiponectin and adiponectin receptors. Endocr Rev 26:439–451 - PubMed
    1. Iwabu M, Yamauchi T, Okada-Iwabu M, Sato K, Nakagawa T, Funata M, Yamaguchi M, Namiki S, Nakayama R, Tabata M, Ogata H, Kubota N, Takamoto I, Hayashi YK, Yamauchi N, Waki H, Fukayama M, Nishino I, Tokuyama K, Ueki K, Oike Y, Ishii S, Hirose K, Shimizu T, Touhara K, Kadowaki T. 2010. Adiponectin and AdipoR1 regulate PGC-1α and mitochondria by Ca(2+) and AMPK/SIRT1. Nature 464:1313–1319 - PubMed
    1. Mao X, Kikani CK, Riojas RA, Langlais P, Wang L, Ramos FJ, Fang Q, Christ-Roberts CY, Hong JY, Kim RY, Liu F, Dong LQ. 2006. APPL1 binds to adiponectin receptors and mediates adiponectin signalling and function. Nat Cell Biol 8:516–523 - PubMed
    1. Deepa SS, Dong LQ. 2009. APPL1: role in adiponectin signaling and beyond. Am J Physiol Endocrinol Metab 296:E22–E36 - PMC - PubMed

Publication types

MeSH terms