. 2011 Sep 30;286(39):34101-20.
doi: 10.1074/jbc.M111.280206. Epub 2011 Aug 11.

A novel E2F-like protein involved in transcriptional activation of cyst wall protein genes in Giardia lamblia

Affiliations

A novel E2F-like protein involved in transcriptional activation of cyst wall protein genes in Giardia lamblia

Li-Hsin Su et al. J Biol Chem. .

Abstract

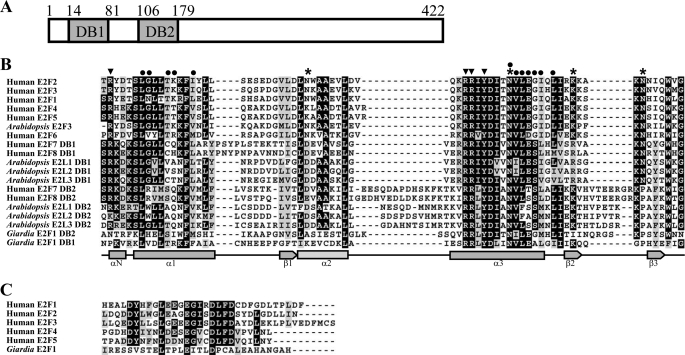
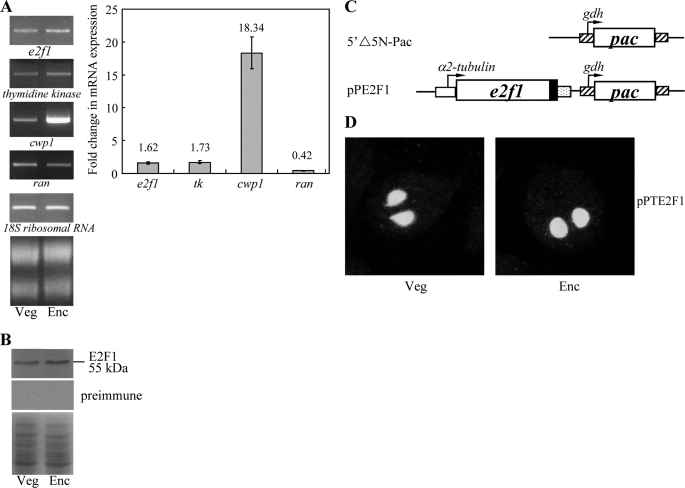
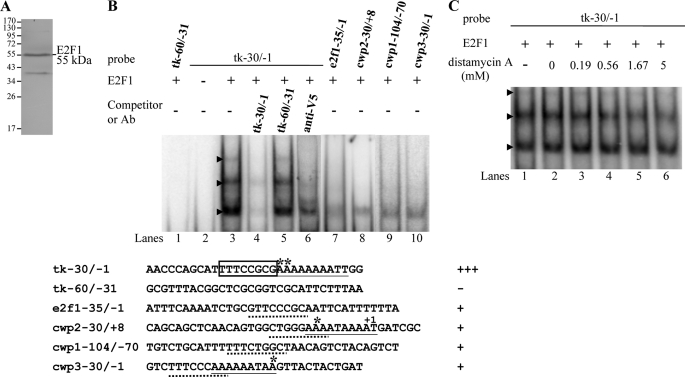
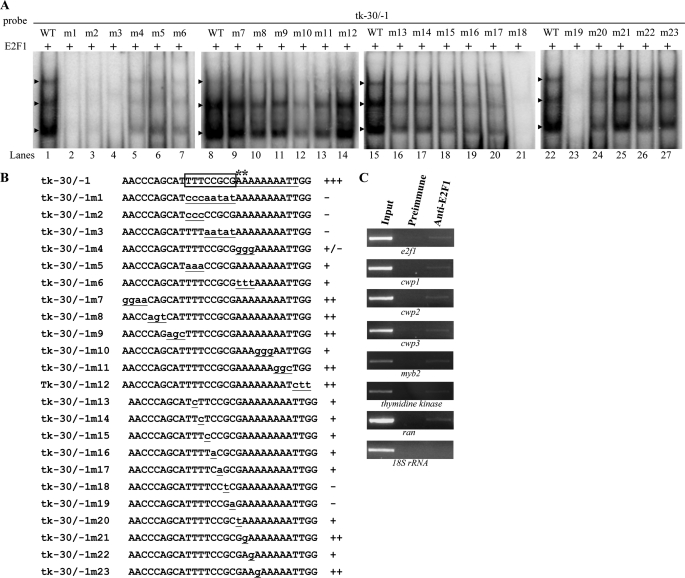
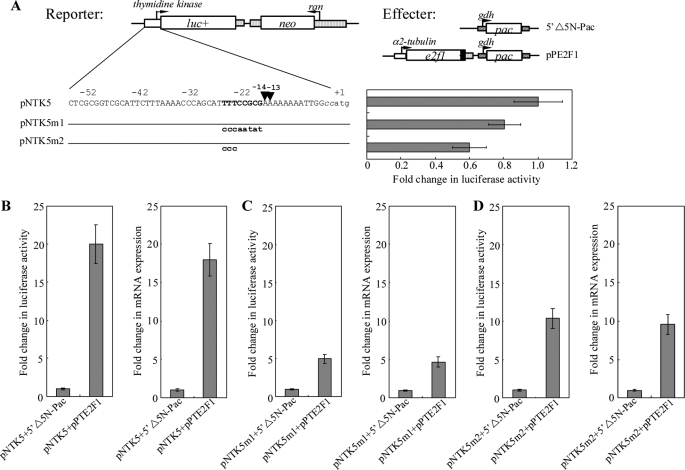
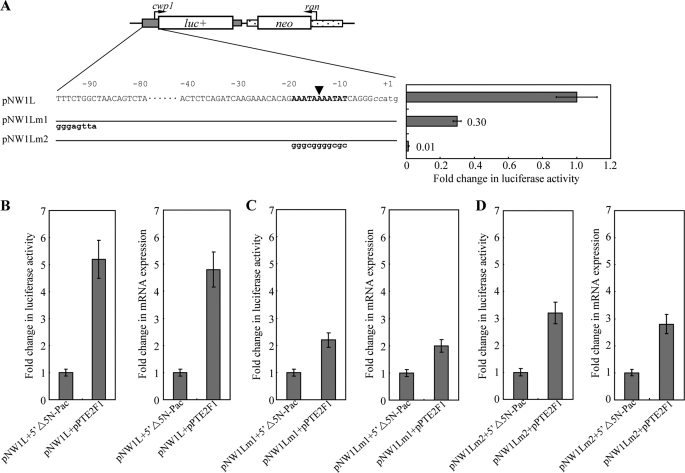
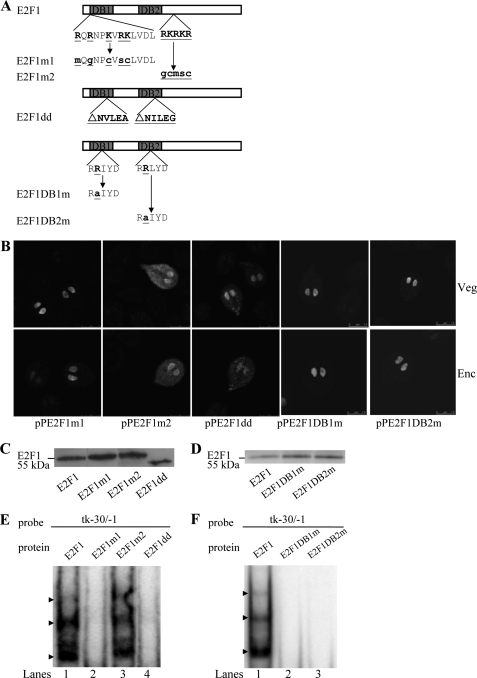
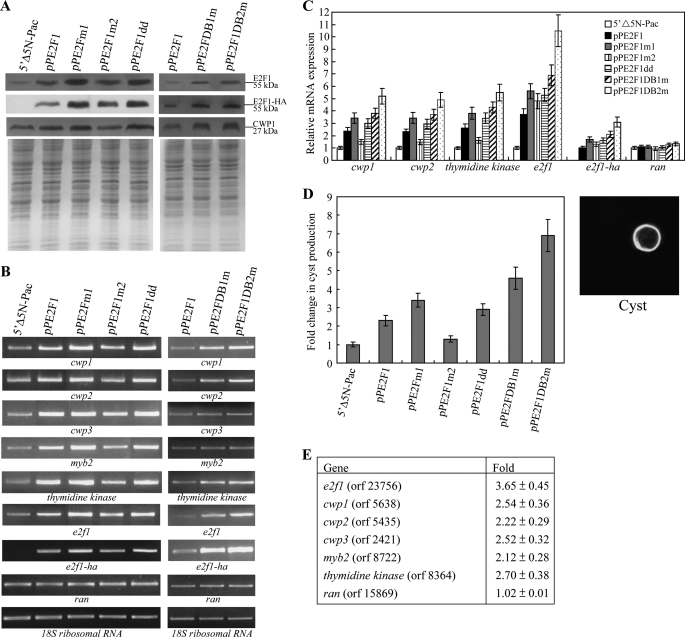
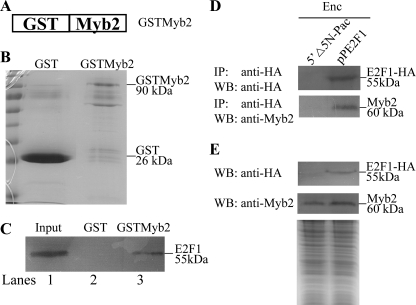
Giardia lamblia differentiates into resistant walled cysts for survival outside the host and transmission. During encystation, synthesis of cyst wall proteins is coordinately induced. The E2F family of transcription factors in higher eukaryotes is involved in cell cycle progression and cell differentiation. We asked whether Giardia has E2F-like genes and whether they influence gene expression during Giardia encystation. Blast searches of the Giardia genome database identified one gene (e2f1) encoding a putative E2F protein with two putative DNA-binding domains. We found that the e2f1 gene expression levels increased significantly during encystation. Epitope-tagged E2F1 was found to localize to nuclei. Recombinant E2F1 specifically bound to the thymidine kinase and cwp1-3 gene promoters. E2F1 contains several key residues for DNA binding, and mutation analysis revealed that its binding sequence is similar to those of the known E2F family proteins. The E2F1-binding sequences were positive cis-acting elements of the thymidine kinase and cwp1 promoters. We also found that E2F1 transactivated the thymidine kinase and cwp1 promoters through its binding sequences in vivo. Interestingly, E2F1 overexpression resulted in a significant increase of the levels of CWP1 protein, cwp1-3 gene mRNA, and cyst formation. We also found E2F1 can interact with Myb2, a transcription factor that coordinate up-regulates the cwp1-3 genes during encystation. Our results suggest that E2F family has been conserved during evolution and that E2F1 is an important transcription factor in regulation of the Giardia cwp genes, which are key to Giardia differentiation into cysts.


Figures

FIGURE 1.
FIGURE 1.
Domain architecture of E2F1 protein and alignment of the DNA-binding domains of E2Fs. A, schematic representation of the giardial E2F1 protein. The gray boxes indicate the two DNA-binding domains (DB1 and DB2). B, alignment of the DNA-binding domains. The DNA-binding domains from members of the E2F family are analyzed by ClustalW 1.83 (86), including human E2F1, E2F2, E2F3, E2F4, E2F5, E2F6, E2F7, and E2F8 (accession numbers are AAC50719, NP_004082, NP_001940, NP_001941, Q15329, O75461, NP_976328, and EAW68354, respectively); Arabidopsis E2F3, E2L1, E2L2, and E2L3 (accession numbers are NP_973611, BAB91412, BAB91413, and BAB91414, respectively); and putative E2F1 from G. lamblia (GenBankTM accession numbers XP_001705587, open reading frames 23756 in the G. lamblia genome database). These E2Fs contain either one or two DNA-binding domains (DB1 and DB2). Letters in black boxes, letters in gray boxes, and hyphens indicate identical amino acids, similar amino acids, and gaps in the respective proteins, respectively. Residues in human E2F4 (49) making heterodimerization contact, DNA base contact, and DNA backbone contact are indicated by circles, arrowheads, and asterisks, respectively. C, alignment of the pRB-binding domains of E2Fs. The C-terminal pRB-binding domains of the human E2F proteins and the C-terminal end of putative E2F1 from G. lamblia are analyzed by ClustalW 1.83 (67, 86).
FIGURE 2.
FIGURE 2.
Analysis of e2f1 gene expression. A, RT-PCR and quantitative real time PCR analysis of e2f1 gene expression. RNA samples were prepared from G. lamblia wild type nontransfected WB cells cultured in growth (Veg, vegetative growth) or encystation medium and harvested at 24 h (Enc, encystation). RT-PCR was performed using primers specific for e2f1, thymidine kinase, cwp1, ran, and 18 S ribosomal RNA genes. Ribosomal RNA quality and loading controls are shown in the bottom panel. Representative results are shown on left. Real time PCR was preformed using primers specific for e2f1, thymidine kinase, cwp1, ran, and 18 S ribosomal RNA genes. Transcript levels were normalized to 18 S ribosomal RNA levels. Fold changes in mRNA expression are shown as the ratio of transcript levels in encysting cells relative to vegetative cells. Results are expressed as the means ± S.E. of at least three separate experiments (right panel). B, E2F1 protein levels in different stages. The wild type nontransfected WB cells were cultured in growth (Veg, vegetative growth) or encystation medium for 24 h (Enc, encystation) and then subjected to SDS-PAGE and Western blot. The blot was probed by anti-E2F1 antibody or preimmune serum. Representative results are shown. Equal amounts of protein loading were confirmed by SDS-PAGE and Coomassie Blue staining. C, diagrams of the 5′Δ5N-Pac and pPE2F1 plasmid. The pac gene (open box) is under the control of the 5′- and 3′-flanking regions of the gdh gene (striated box). In construct pPE2F1, the e2f1 gene is under the control of the 5′-flanking region of the constitutively expressed α2-tubulin promoter (open box) and the 3′-flanking region of the ran gene (dotted box). The filled black box indicates the coding sequence of the HA epitope tag. D, nuclear localization of E2F1. The pPE2F1 stable transfectants were cultured in growth (Veg, vegetative growth, left panels) or encystation medium for 24 h (Enc, encystation, right panels) and then subjected to immunofluorescence analysis using anti-HA antibody for detection. The product of pPE2F1 localizes to the nuclei in both vegetative and encysting trophozoites.
FIGURE 3.
FIGURE 3.
DNA binding ability of E2F1 revealed by electrophoretic mobility shift assays. A, Western blot analysis of recombinant E2F1 protein with a V5 tag at its C terminus purified by affinity chromatography. The purified E2F1 protein is detected by anti-V5-HRP antibody. The lower molecular weight band was a degraded form. B, detection of E2F1-binding sites. Electrophoretic mobility shift assays were performed using purified E2F1 and 32P-end-labeled oligonucleotide probes tk−30/−1, tk−60/−31, or other probes as described. Numbers of the 5′-flanking region of the thymidine kinase (tk) and cwp genes are relative to the translation start site (+1). Components in the binding reaction mixtures are indicated above the lanes. The E2F1 binding specificity for tk−30/−1 probe was confirmed by competition and supershift assays. Some reaction mixtures contained 200-fold molar excess of cold oligonucleotides tk−30/−1 or tk−60/−1 or 0.8 μg of anti-V5-HRP antibody, as indicated above the lanes. The transcription start sites of the thymidine kinase gene determined from vegetative cells are indicated by asterisks. The transcription start sites of the cwp2 and cwp3 gene determined from 24-h encysting cells (15, 23) are indicated by asterisks. The AT-rich Inr element spanning the transcription start sites is underlined. The putative E2F1-binding sequence of the thymidine kinase gene is framed. The putative E2F1-binding sequence of the e2f1, cwp1, cwp2, or cwp3 promoter is underlined. +++, +, and − represent strong binding, weak binding, and no binding, respectively. C, effect of distamycin A on the binding of E2F1 to DNA. 32P-End-labeled tk−30/−1 probe was incubated with E2F1 in the absence (lane 1) or presence of distamycin A (lanes 3–6). The arrowheads indicate the shifted complexes. DistamycinA was dissolved in Me2SO. Adding Me2SO to the reaction mixture did not decrease the E2F1 binding activity (lane 2).
FIGURE 4.
FIGURE 4.
Mutation analysis of the tk−30/−1 probe sequence containing the putative E2F1-binding site. A and B, electrophoretic mobility shift assays were performed using purified E2F1 and various 32P-end-labeled tk−30/−1 mutant probes as described in B. Base changes in the mutants are shown in underlined lowercase type. Components in the binding reaction mixtures are indicated above the lanes. The arrowheads indicate the shifted complexes. The transcription start sites of the thymidine kinase gene determined from vegetative cells are indicated by asterisks. The AT-rich Inr element spanning the transcription start sites is underlined. +, +/−, and − represent moderate binding, weak binding, and no binding, respectively. +++ and ++ represent strong binding. C, recruitment of E2F1 to the cwp1–3, myb2, and thymidine kinase promoters. The nontransfected WB cells were cultured in growth medium for 24 h and then subjected to ChIP assays. Anti-E2F1 was used to assess binding of E2F1 to endogenous gene promoters. Preimmune serum was used as a negative control. Immunoprecipitated chromatin was analyzed by PCR using primers that amplify the 5′-flanking region of specific genes. At least three independent experiments were performed. Representative results are shown. Immunoprecipitated products of E2F1 yielded more PCR products of e2f1, cwp1–3, myb2, thymidine kinase, and ran promoters, indicating that E2F1 was bound to these promoters. The 18 S ribosomal RNA gene promoter was used as a negative control for our ChIP analysis.
FIGURE 5.
FIGURE 5.
Effect of E2F1 on thymidine kinase promoter activity. A, diagrams of the pNTK5, pNTK5m1, and pNTK5m2 plasmids. The firefly luciferase gene (luc+, open box) is flanked by the 5′-flanking region of the thymidine kinase gene and 3′-flanking region of the ran gene (dotted boxes). The neo gene is under the control of the 5′- and 3′-flanking regions of the ran gene (dotted box). Numbers of the 5′-flanking region of the thymidine kinase gene are relative to the translation start site (+1). Two CC nucleotides inserted upstream of the ATG start codon for plasmid construction are shown in lowercase italics. The putative E2F1 binding sequence is in boldface. The mutated sequence in the construct pNTK5m1 or pNTK5m2 is shown in boldface lowercase type. The transcription start sites determined by 5′-RACE from RNA extracted from vegetative cells are indicated by arrowheads. Diagrams of the 5′Δ5N-Pac and pPE2F1 effector plasmid are the same as in Fig. 2C. Specific cell lines were produced by the stable transfection of reporter construct (pNTK5, pNTK5m1, or pNTK5m2). Luciferase activity was measured in vegetative cells as described under “Experimental Procedures.” Fold changes in luciferase expression are shown as the relative expression ratio (experiment/control). Results are expressed as the means ± S.E. of at least three separate experiments (right panel). B–D, transactivation of the thymidine kinase promoter by E2F1 in the co-transfection system. Specific cell lines were produced by the stable co-transfection of reporter construct (pNTK5, pNTK5m1, or pNTK5m2) and the effector construct pPE2F1 or the control construct 5′Δ5N-Pac, which expresses only the puromycin selection marker. Luciferase activity was measured in vegetative cells as described under “Experimental Procedures.” Real time PCR was preformed using primers specific for the luciferase gene and 18 S ribosomal RNA. Transcript levels were normalized to 18 S ribosomal RNA levels. Fold changes in luciferase or mRNA expression are shown as the relative expression ratio (experiment/control). Results are expressed as the means ± S.E. of at least three separate experiments (right panel).
FIGURE 6.
FIGURE 6.
Effect of E2F1 on the cwp1 promoter activity. A, diagrams of the pNW1L, pNW1Lm1, and pNW1Lm2 plasmids. The firefly luciferase gene (luc+, open box) is flanked by the 5′-flanking region of the cwp1 gene and 3′-flanking region of the ran gene (dotted boxes). The neo gene is under the control of the 5′- and 3′-flanking regions of the cwp1 gene (dotted box). Numbers of the 5′-flanking region of the cwp1 gene are relative to the translation start site (+1). Two CC nucleotides inserted upstream of the ATG start codon for plasmid construction are shown in lowercase italics. The AT-rich region spanning the transcription start site is in boldface. The mutated sequence in the construct pNW1Lm1 or pNW1Lm2 is shown in boldface lowercase type. The transcription start site is indicated by an arrowhead (16). Specific cell lines were produced by the stable transfection of reporter construct (pNW1L, pNW1Lm1, or pNW1Lm2). Luciferase activity was measured in vegetative cells as described under “Experimental Procedures.” Fold changes in luciferase expression are shown as the relative expression ratio (experiment/control). Results are expressed as the means ± S.E. of at least three separate experiments (right panel). B–D, activation of the cwp1 promoter by E2F1 in the co-transfection system. Specific cell lines were produced by the stable co-transfection of reporter construct (pNW1L, pNW1Lm1, or pNW1Lm2) and the effector construct pPE2F1 or the control construct 5′Δ5N-Pac, which expresses only the puromycin selection marker (Fig. 2C). Luciferase activity was measured in vegetative cells as described under “Experimental Procedures.” Real time PCR was preformed using primers specific for luciferase gene and 18 S ribosomal RNA. Transcript levels were normalized to 18 S ribosomal RNA levels. Fold changes in luciferase or mRNA expression are shown as the relative expression ratio (experiment/control). Results are expressed as the means ± S.E. of at least three separate experiments (right panel).
FIGURE 7.
FIGURE 7.
Analysis of the DNA-binding domain of E2F1. A, diagrams of the E2F1 and mutant proteins. The gray boxes indicate the E2F1 DNA-binding domains DB1 and DB2. E2F1m1 (or E2F1m2) contains mutation of stretches of basic amino acids between residues 11 and 23 (or between residues 230 and 234) as shown in boldface underlined type. E2F1dd does not contain NVLEA (residues 61–65) and NILEG (residues 155–159) sequence. In E2F1DB1m and E2F1DB2m, the second Arg of the RRXYD DNA recognition motifs are mutated as shown in underlined type. B, localization of the E2F1 mutants. The e2f1 gene was mutated as described (A) and subcloned to replace the wild type e2f1 gene in the backbone of pPE2F1 (Fig. 2C); the resulting plasmids pPE2F1m1, pPE2F1m2, pPE2F1dd, pPE2F1DB1m, and pPE2F1DB2m were transfected into Giardia. The stable transfectants were cultured in growth (Veg, vegetative growth; upper panels) or encystation medium for 24 h (Enc, encystation; lower panels) and then subjected to immunofluorescence analysis using anti-HA antibody for detection. The products of pPE2F1m1, pPE2F1DB1m, and pPE2F1DB2m localize to the nuclei in both vegetative and encysting trophozoites. The product of pPE2F1m2 and pPE2F1dd localize not only in nucleus, suggesting their partial loss of nuclear localization. The product of pPE2F1m2 localizes to the nuclei and cytosol in both vegetative and encysting trophozoites. The product of pPE2F1dd localizes to the nuclei and some vesicles in cytosol in both vegetative and encysting trophozoites. C and D, Western blot analysis of recombinant E2F1 and mutant proteins. The E2F1, E2F1m1, E2F1m2, E2F1dd, E2F1DB1m, or E2F1DB2m protein with a V5 tag at its C terminus was purified by affinity chromatography and then detected by anti-V5-HRP antibody in Western blots. E and F, reduction of DNA binding ability of E2F1 mutants. Electrophoretic mobility shift assays were performed using purified E2F1, E2F1m1, E2F1m2, E2F1dd, E2F1DB1m, E2F1DB2m, and tk−30/−1 probe. The arrowheads indicate the shifted complexes. A postive control reaction was carried out using the wild type E2F1 (lane 1).
FIGURE 8.
FIGURE 8.
Activation of cwp1–3, myb2, and thymidine kinase gene expression in the E2F1-overexpressing cell line. A, overexpression of E2F1 increased the levels of CWP1 protein. The 5′Δ5N-Pac, pPE2F1, pPE2F1m1, pPE2F1m2, pPE2F1dd, pPE2F1DB1m, and pPE2F1DB2m stable transfectants were cultured in growth medium and then subjected to SDS-PAGE and Western blot. The blot was probed by anti-E2F1, anti-HA, and anti-CWP1 antibody. Equal amounts of protein loading were confirmed by SDS-PAGE and Coomassie Blue staining. Representative results are shown. B, RT-PCR analysis of gene expression in the E2F1-overexpressing and E2F1 mutants overexpressing cell lines. The 5′Δ5N-Pac, pPE2F1, pPE2F1m1, pPE2F1m2, pPE2F1dd, pPE2F1DB1m, and pPE2F1DB2m stable transfectants were cultured in growth medium and then subjected to RT-PCR analysis. PCR was preformed using primers specific for e2f1-ha, e2f1, cwp-3, myb2, thymidine kinase, ran, and 18 S ribosomal RNA genes. C, quantitative real time PCR analysis of gene expression in the E2F1-overexpressing and E2F1 mutants overexpressing cell lines. The 5′Δ5N-Pac, pPE2F1, pPE2F1m1, pPE2F1m2, pPE2F1dd, pPE2F1DB1m, and pPE2F1DB2m stable transfectants were cultured in growth medium and then subjected to quantitative real time PCR analysis. Real time PCR was performed using primers specific for e2f1-ha, e2f1, cwp1, cwp2, thymidine kinase, ran, and 18 S ribosomal RNA genes. Similar mRNA levels of the ran and 18 S ribosomal RNA genes for these samples were detected. Transcript levels were normalized to 18 S ribosomal RNA levels. Fold changes in mRNA expression are shown as the ratio of transcript levels in the pPE2F1, pPE2F1m1, pPE2F1m2, pPE2F1dd, pPE2F1DB1m, or pPE2F1DB2m cell lines relative to the 5′Δ5N-Pac cell line. Results are expressed as the means ± S.E. of at least three separate experiments. D, cyst count. The 5′Δ5N-Pac, pPE2F1, pPE2F1m1, pPE2F1m2, pPE2F1dd, pPE2F1DB1m, and pPE2F1DB2m stable transfectants were cultured in growth medium and then subjected to cyst count as described under “Experimental Procedures.” The sum of total cysts is expressed as relative expression level over control. Values are shown as means ± S.E. (left panel). Cysts were subjected to immunofluorescence analysis, using anti-CWP1 antibody for detection. The CWP1 localizes to the cyst wall in a representative cyst (right panel). E, microarray analysis. Microarray data were obtained from the 5′Δ5N-Pac and pPE2F1 cell lines during vegetative growth. Fold change are shown as the ratio of transcript levels in the pPE2F1 cell line relative to the 5′Δ5N-Pac cell line. Results are expressed as the means ± S.E. of at least three separate experiments.
FIGURE 9.
FIGURE 9.
Interaction between E2F1 and Myb2. A, schematic representation of GSTMyb2 fusion protein. Full-length Myb2 was fused to the C terminus of GST. B, presence of bound GST and GSTMyb2 in the glutathione-Sepharose beads. Following binding of GST and GSTMyb2 and extensive washing, the glutathione-Sepharose beads were subjected for SDS-PAGE. GST and GSTMyb2 were visualized by Coomassie Blue staining. C, interaction between E2F1 and Myb2 by GST pulldown assay. Purified recombinant E2F1 with a C-terminal V5 tag was mixed with GST protein, and GSTMyb2 fusion proteins in the glutathione-Sepharose beads and the pulldown fractions were analyzed. Five percent of the input (lane 1) and 25% of the pulldown material (lanes 2 and 3) were subjected to Western blot analysis. V5-tagged E2F1 was detected using anti-V5-HRP antibody. D, co-immunoprecipitation assays. The 5′Δ5N-Pac and pPE2F1 stable transfectants were cultured in encystation medium for 24 h. Proteins from cell lysates were immunoprecipitated (IP) using anti-HA antibody conjugated to beads. The precipitates were analyzed by Western blot (WB) with anti-HA or anti-Myb2 antibody as indicated. E, expression of the HA-tagged E2F1 and Myb2 proteins in whole cell extracts. The 5′Δ5N-Pac and pPE2F1 stable transfectants were cultured in encystation medium for 24 h (Enc, encystation) and then subjected to Western blot analysis. The blot was probed by anti-HA and anti-Myb2 antibody. Equal amounts of protein loading were confirmed by SDS-PAGE and Coomassie Blue staining.

Similar articles

Cited by

References

    1. Wolfe M. S. (1992) Clin. Microbiol. Rev. 5, 93–100 - PMC - PubMed
    1. Adam R. D. (2001) Clin. Microbiol. Rev. 14, 447–475 - PMC - PubMed
    1. Ankarklev J., Jerlström-Hultqvist J., Ringqvist E., Troell K., Svärd S. G. (2010) Nat. Rev. Microbiol. 8, 413–422 - PubMed
    1. Celiksöz A., Aciöz M., Değerli S., Cinar Z., Elaldi N., Erandaç M. (2005) Pediatr. Int. 47, 567–571 - PubMed
    1. Gillin F. D., Reiner D. S., McCaffery J. M. (1996) Annu. Rev. Microbiol. 50, 679–705 - PubMed

Publication types

MeSH terms

Substances