

Skewed riskscapes and gentrified inequities: environmental exposure disparities in Seattle, Washington
- PMID: 21836115
- PMCID: PMC3222488
- DOI: 10.2105/AJPH.2011.300174
Skewed riskscapes and gentrified inequities: environmental exposure disparities in Seattle, Washington
Abstract
Objectives: Few studies have considered the sociohistorical intersection of environmental injustice and gentrification; a gap addressed by this case study of Seattle, Washington. This study explored the advantages of integrating air toxic risk screening with gentrification research to enhance proximity and health equity analysis methodologies. It was hypothesized that Seattle's industrial air toxic exposure risk was unevenly dispersed, that gentrification stratified the city's neighborhoods, and that the inequities of both converged.
Methods: Spatial characterizations of air toxic pollution risk exposures from 1990 to 2007 were combined with longitudinal cluster analysis of census block groups in Seattle, Washington, from 1990 to 2000.
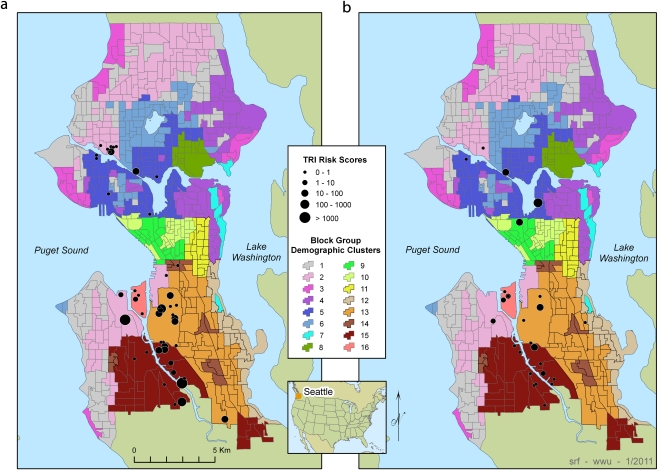
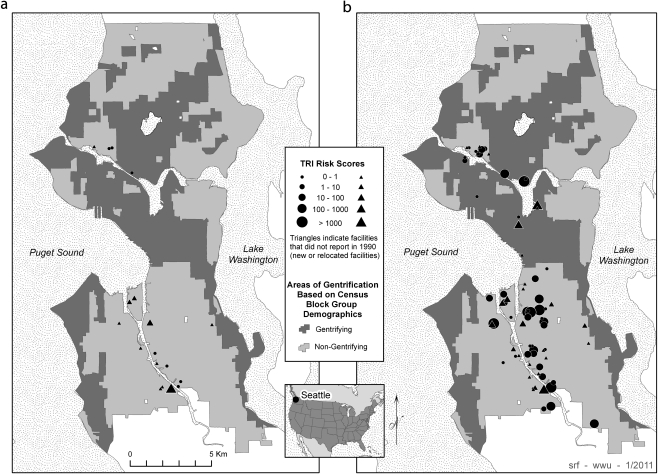
Results: A cluster of air toxic exposure inequality and socioeconomic inequity converged in 1 area of south central Seattle. Minority and working class residents were more concentrated in the same neighborhoods near Seattle's worst industrial pollution risks.
Conclusions: Not all pollution was distributed equally in a dynamic urban landscape. Using techniques to examine skewed riskscapes and socioeconomic urban geographies provided a foundation for future research on the connections among environmental health hazard sources, socially vulnerable neighborhoods, and health inequity.
Figures
References
-
- Bowen WM, Salling MJ, Haynes KE, Cyran EJ. Toward environmental justice: spatial equity in Ohio and Cleveland. Ann Assoc Am Geogr. 1995;85(4):641–663
-
- Boer JT, Pastor M, Jr, Sadd JL, Snyder LD. Is there environmental racism? The demographics of hazardous waste in Los Angeles County: research on the evironment. Soc Sci Q. 1997;78(4):793–810
-
- Bullard RD. Solid waste sites and the Black Houston community. Sociol Inq. 1983;53(2/3):273–288 - PubMed
-
- Fisher JB, Kelly M, Romm J. Scales of environmental justice: combining GIS and spatial analysis for air toxics in West Oakland, California. Health Place. 2006;12:701–714 - PubMed
Publication types
MeSH terms
LinkOut - more resources
Full Text Sources
Medical
Miscellaneous
