Comparative Study
. 2011 Nov 1;184(9):1076-84.
doi: 10.1164/rccm.201103-0536OC.

A multisite assessment of the quantitative capabilities of the Xpert MTB/RIF assay

Affiliations
Comparative Study

A multisite assessment of the quantitative capabilities of the Xpert MTB/RIF assay

Robert Blakemore et al. Am J Respir Crit Care Med. .

Abstract

Rationale: The Xpert MTB/RIF is an automated molecular test for Mycobacterium tuberculosis that estimates bacterial burden by measuring the threshold-cycle (Ct) of its M. tuberculosis-specific real-time polymerase chain reaction. Bacterial burden is an important biomarker for disease severity, infection control risk, and response to therapy.

Objectives: Evaluate bacterial load quantitation by Xpert MTB/RIF compared with conventional quantitative methods.

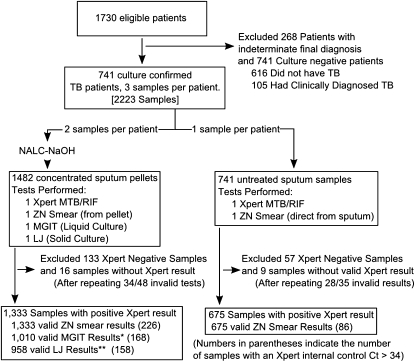
Methods: Xpert MTB/RIF results were compared with smear-microscopy, semiquantiative solid culture, and time-to-detection in liquid culture for 741 patients and 2,008 samples tested in a multisite clinical trial. An internal control real-time polymerase chain reaction was evaluated for its ability to identify inaccurate quantitative Xpert MTB/RIF results.

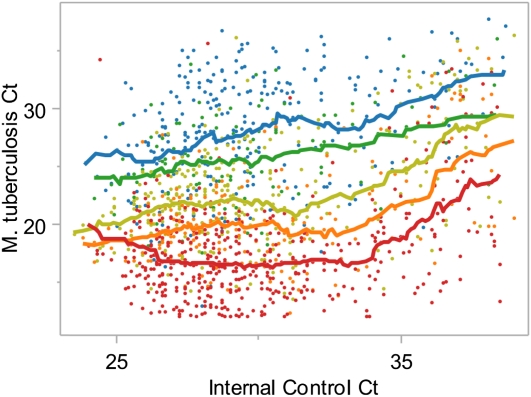
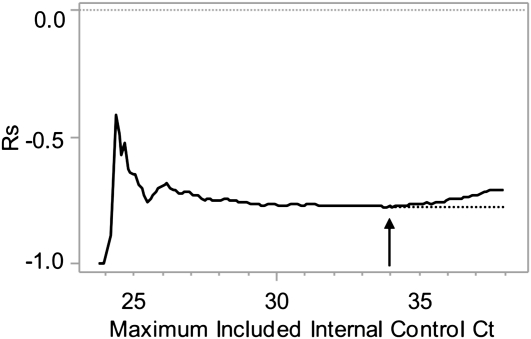
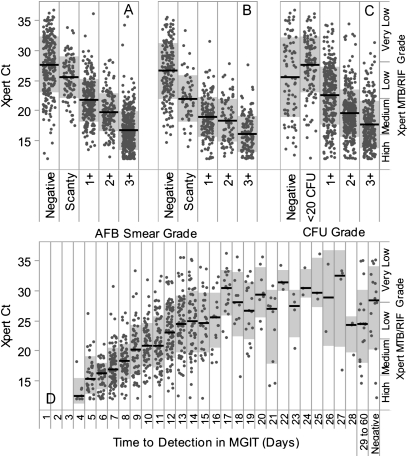
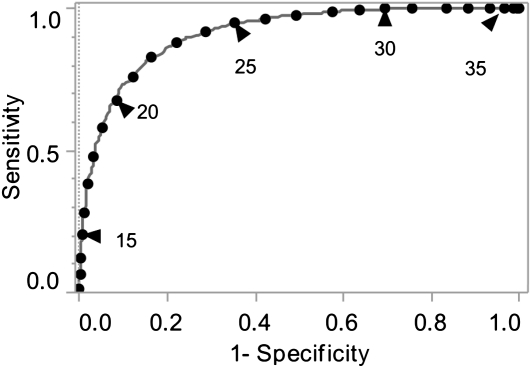
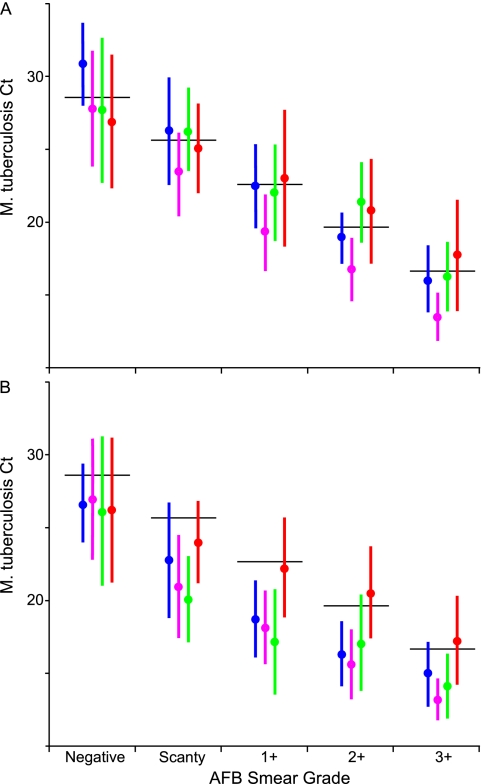
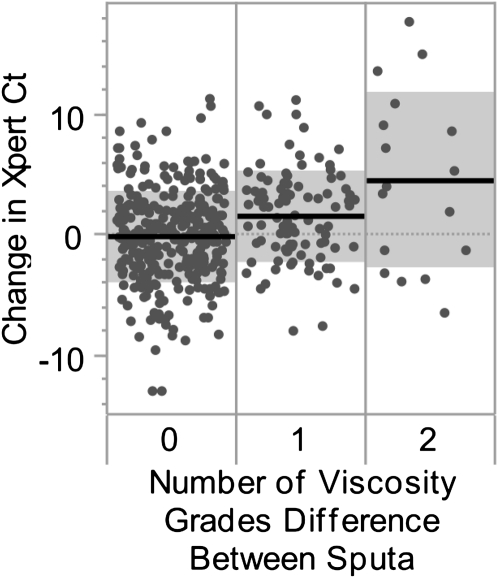
Measurements and main results: Assays with an internal control Ct greater than 34 were likely to be inaccurately quantitated; this represented 15% of M. tuberculosis-positive tests. Excluding these, decreasing M. tuberculosis Ct was associated with increasing smear microscopy grade for smears of concentrated sputum pellets (r(s) = -0.77) and directly from sputum (r(s) =-0.71). A Ct cutoff of approximately 27.7 best predicted smear-positive status. The association between M. tuberculosis Ct and time-to-detection in liquid culture (r(s) = 0.68) and semiquantitative colony counts (r(s) = -0.56) was weaker than smear. Tests of paired same-patient sputum showed that high viscosity sputum samples contained ×32 more M. tuberculosis than nonviscous samples. Comparisons between the grade of the acid-fast bacilli smear and Xpert MTB/RIF quantitative data across study sites enabled us to identify a site outlier in microscopy.

Conclusions: Xpert MTB/RIF quantitation offers a new, standardized approach to measuring bacterial burden in the sputum of patients with tuberculosis.


Figures

Figure 1.
Figure 1.
Patient samples used in this study. A flow diagram for sample inclusion and exclusion is shown. LJ = culture on Löwenstein–Jensen agar slants; MGIT = mycobacterial growth indicator tubes; NACL-NaOH = treatment with NALC-NaOH as in (17); TB = tuberculosis; ZN = Ziehl-Neelsen staining. *MGIT results excluded 80 samples from Site E for which no time-to-detection data were collected, 234 samples collected from patients being treated for Mycobacterium tuberculosis at the time of sample collection, and 9 samples for which the MGIT culture was contaminated. **LJ results excluded 80 samples from Site E that were cultured on a different solid media (Middlebrook 7H11) than at the rest of the sites, 234 samples collected from patients on M. tuberculosis therapy at time of collection, and 61 contaminated cultures.
Figure 2.
Figure 2.
Relationship between the internal control cycle-threshold (Ct) and accuracy of quantitation. The Mycobacterium tuberculosis Cts for all concentrated sputum samples that produced a positive internal control result are shown plotted against the internal control Ct. Each dot represents a single Xpert test. Colors indicate acid-fast bacilli smear grade of a given sample: red, 3+; orange, 2+; yellow, 1+; green, scanty; and blue, smear-negative. Matched line colors show a moving average of M. tuberculosis Ct within the corresponding smear grade looking back 15 tests and ahead five tests.
Figure 3.
Figure 3.
Influence of internal control cycle-threshold (Ct) on calculated Spearman rank. The calculated Spearman rank correlation (rs) between Mycobacterium tuberculosis Ct and acid-fast bacilli smear grade for all concentrated sputum samples is shown for each maximum allowed internal control Ct. The arrow indicates the point of maximum correlation. The dotted line indicates the trend in Spearman rank correlation that would have been expected in the absence of polymerase chain reaction inhibition.
Figure 4.
Figure 4.
(A–D) Xpert quantitation compared with conventional quantitative measures. The distribution of Mycobacterium tuberculosis cycle-threshold (Cts) within each smear grade or quantitative culture category is shown. Only tests with an internal control Ct less than 34 are included. Each dot indicates a single tested sputum sample; dots are randomly distributed horizontally within each category to avoid overlap. Black lines indicate the median Xpert M. tuberculosis Ct and gray boxes indicate average ± one standard deviation. Xpert M. tuberculosis Ct is compared with (A) smear grade of concentrated samples, (B) smear grade of direct sputum smears, (C) semiquantitative solid culture cfu grade on culture on Löwenstein–Jensen agar slants, and (D) time to detection in days in a BACTEC mycobacterial growth indicator tubes (MGIT) 960. The semiquantitative scale produced by Xpert software is indicated on the right margin. For (D) days 29–60 have been combined in a single column and “negative” indicates all tests with no growth after 60 days. AFB = acid-fast bacilli.
Figure 5.
Figure 5.
Cycle-threshold (Ct) cutoff for smear-positive samples. The receiver operating characteristic (ROC) of Mycobacterium tuberculosis Ct as a test for smear-positive sputum is shown. Only tests with an internal control Ct less than 34 were included. Smear positivity was defined as all concentrated sputum samples that were grade 1+ or greater. The gray line indicates the ROC curve. The black circles indicate 1-Ct increments on the ROC curve, and black circles with a black triangle indicate each 5th Ct as labeled.
Figure 6.
Figure 6.
Mycobacterium tuberculosis cycle-threshold (Ct) compared with expected “ideal” Ct for each smear grade. The average M. tuberculosis Ct for each smear grade at each test site is shown compared with the “expected” ideal average Ct. Tests with an internal control Ct greater than 34 were excluded. (A) Tests performed from sputum pellets. (B) Tests performed directly from sputum. Filled circles indicate the average M. tuberculosis Ct per grade and vertical bars indicate ± one standard deviation. Sites are ordered alphabetically: A (blue); B (pink); C (green); and D (red). Site E was excluded because of low sample size. The calculated “ideal” Cts for each grade are indicated by a solid black horizontal line and indicate a difference in Ct equivalent to a ×10 change in cfu per milliliter in adjacent categories. AFB = acid-fast bacilli.
Figure 7.
Figure 7.
Cycle-threshold (Ct) differences between paired samples with same or different viscosities. The Mycobacterium tuberculosis Ct between concentrated sputum samples collected from a single patient is shown. Only tests with an internal control Ct less than 34 were included. Specimens were graded as “very viscous” (VV), “viscous” (V), or “not viscous/watery” (NV/W). Specimen pairs assigned the same viscosity category (both VV, both V, or both NV/W) are indicated in the left column. Specimen pairs with a one-grade difference (VV and V, or V and NV/W) are in the middle column. Specimen pairs with a two-grade difference (VV and NV/W) are in the right column. Each dot indicates a pair of specimens and dots are randomly distributed horizontally to reduce overlap. The mean change in M. tuberculosis Ct in each group is indicated by a solid black line. Gray boxes indicate ± one standard deviation.

References

    1. Palaci M, Dietze R, Hadad DJ, Ribeiro FK, Peres RL, Vinhas SA, Maciel EL, do Valle Dettoni V, Horter L, Boom WH, et al. Cavitary disease and quantitative sputum bacillary load in cases of pulmonary tuberculosis. J Clin Microbiol 2007;45:4064–4066 - PMC - PubMed
    1. Perrin FM, Woodward N, Phillips PP, McHugh TD, Nunn AJ, Lipman MC, Gillespie SH. Radiological cavitation, sputum mycobacterial load and treatment response in pulmonary tuberculosis. Int J Tuberc Lung Dis 2010;14:1596–1602 - PubMed
    1. Small PM, Pai M. Tuberculosis diagnosis—time for a game change. N Engl J Med 2010;363:1070–1071 - PubMed
    1. Multiple misdiagnoses of tuberculosis resulting from laboratory error—Wisconsin, 1996. MMWR Morb Mortal Wkly Rep 1997;46:797–801 - PubMed
    1. de CRM, Soini H, Roscanni GC, Jaques M, Villares MC, Musser JM. Extensive cross-contamination of specimens with Mycobacterium tuberculosis in a reference laboratory. J Clin Microbiol 1999;37:916–919 - PMC - PubMed

Publication types

MeSH terms