

Geographic variation in colorectal cancer survival and the role of small-area socioeconomic deprivation: a multilevel survival analysis of the NIH-AARP Diet and Health Study Cohort
- PMID: 21836166
- PMCID: PMC3203377
- DOI: 10.1093/aje/kwr162
Geographic variation in colorectal cancer survival and the role of small-area socioeconomic deprivation: a multilevel survival analysis of the NIH-AARP Diet and Health Study Cohort
Abstract
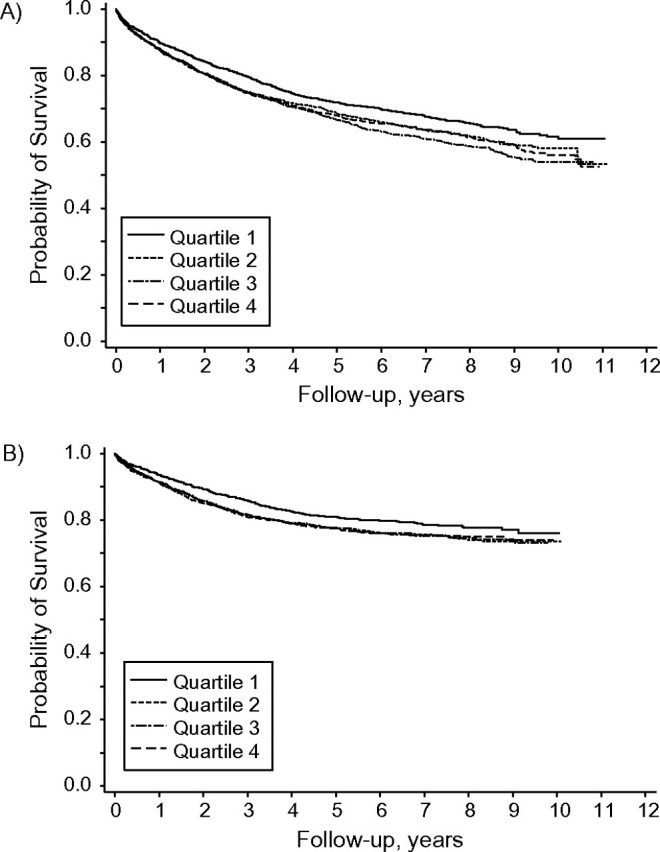
Adverse socioeconomic conditions, at both the individual and the neighborhood level, increase the risk of colorectal cancer (CRC) death, but little is known regarding whether CRC survival varies geographically and the extent to which area-level socioeconomic deprivation affects this geographic variation. Using data from the National Institutes of Health (NIH)-AARP Diet and Health Study, the authors examined geographic variation and the role of area-level socioeconomic deprivation in CRC survival. CRC cases (n = 7,024), identified during 1995-2003, were followed for their CRC-specific vital status through 2005 and overall vital status through 2006. Bayesian multilevel survival models showed that there was significant geographic variation in overall (variance = 0.2, 95% confidence interval (CI): 0.1, 0.2) and CRC-specific (variance = 0.3, 95% CI: 0.1, 0.4) risk of death. More socioeconomically deprived neighborhoods had a higher overall risk of death (most deprived quartile vs. least deprived: hazard ratio = 1.2, 95% CI: 1.1, 1.4) and a higher CRC-specific risk of death (most deprived quartile vs. least deprived: hazard ratio = 1.2, 95% CI: 1.1, 1.5). However, neighborhood socioeconomic deprivation did not account for the geographic variation in overall and CRC-specific risks of death. In future studies, investigators should evaluate other neighborhood characteristics to help explain geographic heterogeneity in CRC survival. Such research could facilitate interventions for reducing geographic disparity in CRC survival.
Figures
Similar articles
-
Ten-year change in neighborhood socioeconomic status and colorectal cancer.Cancer. 2019 Feb 15;125(4):610-617. doi: 10.1002/cncr.31832. Epub 2018 Nov 13. Cancer. 2019. PMID: 30423200 Free PMC article.
-
Geographic disparities in colorectal cancer survival.Int J Health Geogr. 2009 Jul 23;8:48. doi: 10.1186/1476-072X-8-48. Int J Health Geogr. 2009. PMID: 19627576 Free PMC article.
-
Health status, neighborhood socioeconomic context, and premature mortality in the United States: The National Institutes of Health-AARP Diet and Health Study.Am J Public Health. 2012 Apr;102(4):680-8. doi: 10.2105/AJPH.2011.300158. Epub 2011 Nov 28. Am J Public Health. 2012. PMID: 21852636 Free PMC article.
-
Social inequalities in health: How do they influence the natural history of colorectal cancer?J Visc Surg. 2023 Jun;160(3):203-213. doi: 10.1016/j.jviscsurg.2023.02.002. Epub 2023 Apr 14. J Visc Surg. 2023. PMID: 37062638 Review.
-
Use Of Area-Based Socioeconomic Deprivation Indices: A Scoping Review And Qualitative Analysis.Health Aff (Millwood). 2022 Dec;41(12):1804-1811. doi: 10.1377/hlthaff.2022.00482. Health Aff (Millwood). 2022. PMID: 36469826
Cited by
-
A Renewed Focus on Health Disparities in the Year 2020: Reexamining Geospatial Disparities.Cancer Epidemiol Biomarkers Prev. 2020 Nov;29(11):2107-2108. doi: 10.1158/1055-9965.EPI-20-1221. Cancer Epidemiol Biomarkers Prev. 2020. PMID: 33139304 Free PMC article.
-
Missed opportunities: racial and neighborhood socioeconomic disparities in emergency colorectal cancer diagnosis and surgery.BMC Cancer. 2014 Dec 9;14:927. doi: 10.1186/1471-2407-14-927. BMC Cancer. 2014. PMID: 25491412 Free PMC article.
-
Effects of Cancer Stage and Treatment Differences on Racial Disparities in Survival From Colon Cancer: A United States Population-Based Study.Gastroenterology. 2016 May;150(5):1135-1146. doi: 10.1053/j.gastro.2016.01.030. Epub 2016 Feb 2. Gastroenterology. 2016. PMID: 26836586 Free PMC article.
-
Protocol paper for an implementation science approach to promoting colorectal cancer screening in Federally Qualified Health Center clinics: A stepped-wedge, multilevel intervention trial.Res Sq [Preprint]. 2024 Jul 18:rs.3.rs-4558718. doi: 10.21203/rs.3.rs-4558718/v1. Res Sq. 2024. PMID: 39070625 Free PMC article. Preprint.
-
Statistical Assessment of Neighborhood Socioeconomic Deprivation Environment in Spatial Epidemiologic Studies.Open J Stat. 2016 Jun;6(3):436-442. doi: 10.4236/ojs.2016.63039. Epub 2016 Jun 14. Open J Stat. 2016. PMID: 27413589 Free PMC article.
References
-
- Jemal A, Siegel R, Ward E, et al. Cancer statistics, 2009. CA Cancer J Clin. 2009;59(4):225–249. - PubMed
-
- National Cancer Institute. The NCI Strategic Plan for Leading the Nation to Eliminate the Suffering and Death Due to Cancer. Washington, DC: National Cancer Institute; 2006.
-
- Shalala DE, Satcher D. Healthy People 2010— Conference Edition. Darby, PA: DIANE Publishing Company; 2000.
-
- Aarts MJ, Lemmens VE, Louwman MW, et al. Socioeconomic status and changing inequalities in colorectal cancer? A review of the associations with risk, treatment and outcome. Eur J Cancer. 2010;46(15):2681–2695. - PubMed
Publication types
MeSH terms
Grants and funding
LinkOut - more resources
Full Text Sources
Medical
