. 2011 Oct;8(5):056004.
doi: 10.1088/1478-3975/8/5/056004. Epub 2011 Aug 12.

Modeling the effects of drug binding on the dynamic instability of microtubules

Affiliations

Modeling the effects of drug binding on the dynamic instability of microtubules

Peter Hinow et al. Phys Biol. 2011 Oct.

Abstract

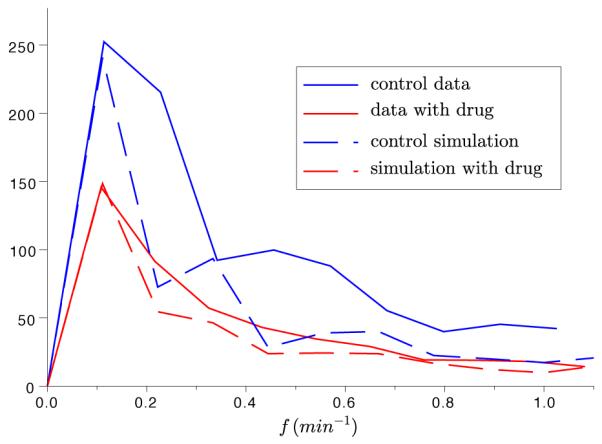
We propose a stochastic model that accounts for the growth, catastrophe and rescue processes of steady-state microtubules assembled from MAP-free tubulin in the possible presence of a microtubule-associated drug. As an example of the latter, we both experimentally and theoretically study the perturbation of microtubule dynamic instability by S-methyl-D-DM1, a synthetic derivative of the microtubule-targeted agent maytansine and a potential anticancer agent. Our model predicts that among the drugs that act locally at the microtubule tip, primary inhibition of the loss of GDP tubulin results in stronger damping of microtubule dynamics than inhibition of GTP tubulin addition. On the other hand, drugs whose action occurs in the interior of the microtubule need to be present in much higher concentrations to have visible effects.


Figures

Figure 1
Figure 1
The reactions and possible drug interactions implemented in our stochastic model. A drug may also promote polymerization and depolymerization.
Figure 2
Figure 2
(Left panel) Schematic depiction of the two hydrolysis mechanisms. The scalar hydrolysis reaction (p. 4 (iv), top) picks a random bound GTP tubulin and changes it into a bound GDP tubulin. The vectorial hydrolysis reaction (p. 5 (v), bottom) occurs at a boundary between a GDP zone and a GTP zone. (Right panel) Structural formula of the maytansine analog S-methyl-D-DM1.
Figure 3
Figure 3
(Left panel) Length time series of 10 microtubules in absence of drug. Notice that life histories from several experiments are plotted in the same diagram. (Right panel) Absolute Fourier spectra of the control experimental data that were normalized to mean length zero. The thick blue line is the average of the 10 individual spectra.
Figure 4
Figure 4
(Left panel) Simulation of m = 5 microtubules starting from random initial states, with a total of ≈ 105 tubulin units. The parameter values are as in Table 1. GTP tubulin is added in the form of oligomers whose length is Poisson distributed with with mean L = 6. The resulting average growth velocity during periods of growth is approximately 2 μm min−1 while the resulting shrinking velocity is approximately 20 μm min−1. (Right panel) Absolute Fourier spectra of the simulation data, normalized to mean length zero. The thick blue line is the average of the 5 individual spectra.
Figure 5
Figure 5
(Left panel) Simulation of m = 5 microtubules with parameter values as in Table 1 and Figure 4 except that GTP tubulin is added in units of fixed length L = 1. (Right panel) Absolute Fourier spectra of the simulation data, normalized to mean length zero and their average.
Figure 6
Figure 6
(Left panel) Simulation of m = 5 microtubules with parameter values λ=1.0(s)1, μGDP = 2000 s−1, δsc=δvec=3.0(s)1 and κ = 0.5 s−1, all of which are larger than those in Table 1. (Right panel) The corresponding absolute Fourier spectra show a visible shift towards higher frequencies.
Figure 7
Figure 7
(Left panel) Length time series of 10 microtubules in presence of the drug S-methyl-D-DM1. (Right panel) The corresponding absolute Fourier spectra, normalized to mean length zero. The thick blue line is the average of the 10 individual spectra.
Figure 8
Figure 8
(Left panel) Simulation of m = 5 microtubules in the presence of 400 drug molecules, with a total of ≈ 105 tubulin units. The parameter values are as in Figure 4, in addition r = 0.01, q = 0 and s = 1. Here the drug molecules bind to any open site with equal probability. (Right panel) The corresponding absolute Fourier spectra. This simulation suggests a possible action mechanism for the drug S-methyl-D-DM1.
Figure 9
Figure 9
Detail of the average absolute Fourier spectra from Figures 3, 4, 7 and 8. Within the resolution of the frequency grid ≈ 0.11 min−1, there is no discernible shift of the position of the peaks.
Figure 10
Figure 10
Simulation of m = 5 microtubules with a total of ≈ 105 tubulin units in the presence a drug that completely inhibits GTP tubulin hydrolysis. The relevant parameter values are r = q = 1 and s = 0. The total amount of drug is 20000 (left panel) respectively 40000 (right panel).
Figure 11
Figure 11
The reduction of microtubule dynamic instability relative to the untreated case as the drug effects vary. Shown are the relative peak heights of the averaged absolute Fourier spectra of 20 microtubules at a concentration of 100 drug molecules for every microtubule. The drug molecules bind either at any open site along the microtubule (left panel) or at the tip only (right panel). The drug does not affect the hydrolysis of bound GTP tubulin (s = 1).

Similar articles

Cited by

References

    1. Jackson MB, Berkovitz SA. Nucleation and the kinetics of microtubule assembly. Proc. Natl. Acad. Sci. USA. 1980;77:7302–7305. - PMC - PubMed
    1. Mandelkow E, Mandelkow EM, Hotani H, Hess B, Müller SC. Spatial patterns from oscillating microtubules. Science. 1989;246:1291–1293. - PubMed
    1. Walker RA, O’Brien ET, Pryer NK, Soboeiro ME, Voter WA, Erickson HP, Salmon ED. Dynamic instability of individual microtubules analyzed by video light microscopy: rate constants and transition frequencies. J. Cell Biol. 1988;107:1437–1448. - PMC - PubMed
    1. Bolterauer H, Limbach H–J, Tuszyński JA. Microtubules: strange polymers inside the cell. Bioelectrochem. Bioenerg. 1999;48:285–295. - PubMed
    1. Bolterauer H, Limbach H–J, Tuszyński JA. Models of assembly and disassembly of individual microtubules: stochastic and averaged equations. J. Biol. Phys. 1999;25:1–22. - PMC - PubMed

Publication types