

Evaluation of specific metabolic rates of major organs and tissues: comparison between nonobese and obese women
- PMID: 21836642
- PMCID: PMC3319030
- DOI: 10.1038/oby.2011.256
Evaluation of specific metabolic rates of major organs and tissues: comparison between nonobese and obese women
Abstract
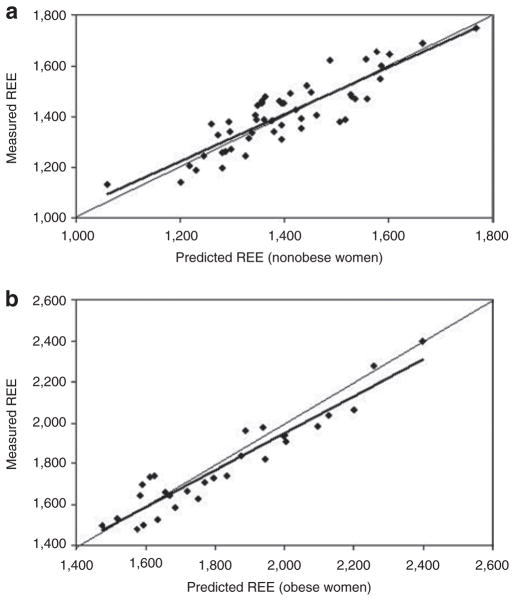
Elia (1992) identified the specific resting metabolic rates (K(i)) of major organs and tissues in young adults with normal weight: 200 for liver, 240 for brain, 440 for heart and kidneys, 13 for skeletal muscle, 4.5 for adipose tissue and 12 for residual mass (all units in kcal/kg per day). The aim of the present study was to assess the applicability of Elia's K(i) values for obese adults. A sample of young women (n = 80) was divided into two groups, nonobese (BMI <29.9 kg/m(2)) and obese (BMI 30.0-43.2 kg/m(2)). This study was based on the mechanistic model: REE = σ (K(i) × T(i)), where REE is whole-body resting energy expenditure measured by indirect calorimetry and T(i) is the mass of individual organs and tissues measured by magnetic resonance imaging. For each organ/tissue, the corresponding Elia's K(i) value was analyzed respectively for nonobese and obese groups by using stepwise univariate regression analysis. Elia's K(i) values were within the range of 95% confidence intervals (CIs) in the nonobese group. However, Elia's K(i) values were outside the right boundaries of 95% CIs in the obese group and a corresponding obesity-adjusted coefficient was calculated as 0.98, indicating that Elia's values overestimate K(i) by 2.0% in obese adults. Obesity-adjusted K(i) values were 196 for liver, 235 for brain, 431 for heart and kidneys, 12.7 for skeletal muscle, 4.4 for adipose tissue, and 11.8 for residual mass. In conclusion, although Elia's K(i) values were validated in nonobese women, obesity-adjustments are appropriate for application in obese women.
Conflict of interest statement
The authors declared no conflict of interest.
Figures


References
-
- Elia M. Organ and tissue contribution to metabolic rate. In: Kinney JM, Tucker HN, editors. Energy Metabolism: Tissue Determinants and Cellular Corollaries. Raven Press; New York: 1992. pp. 61–80.
-
- FAO/WHO/UNU. Human Energy Requirements. Report of Joint FAO/WHO/UNU Expert Consultation; Rome. 2004. pp. 35–50.
-
- Wang Z, Heshka S, Heymsfield SB, Shen W, Gallagher D. A cellular-level approach to predicting resting energy expenditure across the adult years. Am J Clin Nutr. 2005;81:799–806. - PubMed
-
- Gallagher D, Allen A, Wang Z, Heymsfield SB, Krasnow N. Smaller organ tissue mass in the elderly fails to explain lower resting metabolic rate. Ann N Y Acad Sci. 2000;904:449–455. - PubMed
-
- Hsu A, Heshka S, Janumala I, et al. Larger mass of high-metabolic-rate organs does not explain higher resting energy expenditure in children. Am J Clin Nutr. 2003;77:1506–1511. - PubMed
Publication types
MeSH terms
Grants and funding
LinkOut - more resources
Full Text Sources
Medical
