

Spatial visualization of multivariate datasets: an analysis of STD and HIV/AIDS diagnosis rates and socioeconomic context using ring maps
- PMID: 21836744
- PMCID: PMC3150136
- DOI: 10.1177/00333549111260s316
Spatial visualization of multivariate datasets: an analysis of STD and HIV/AIDS diagnosis rates and socioeconomic context using ring maps
Abstract
Objectives: We used existing data systems to examine sexually transmitted disease (STD) and HIV/AIDS diagnosis rates and explore potential county-level associations between HIV/AIDS diagnosis rates and socioeconomic disadvantage.
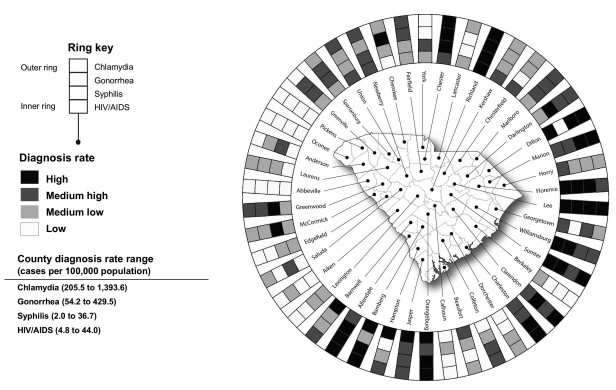
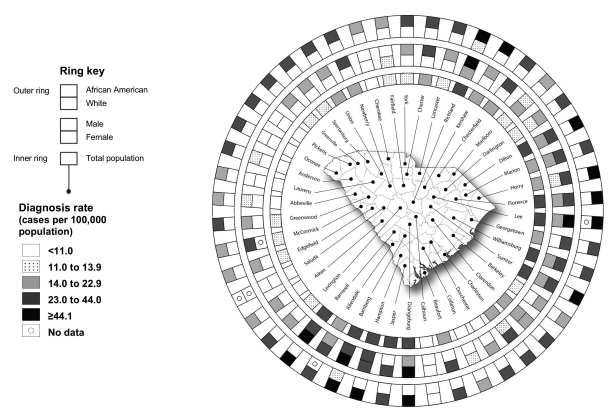
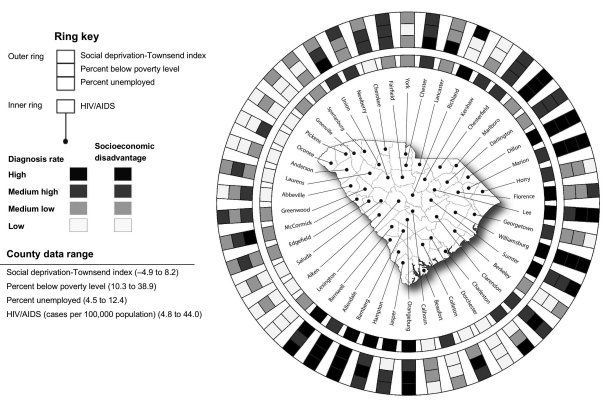
Methods: Using South Carolina county data, we constructed multivariate ring maps to spatially visualize syphilis, gonorrhea, chlamydia, and HIV/AIDS diagnosis rates; gender- and race-specific HIV/AIDS diagnosis rates; and three measures of socioeconomic disadvantage-an unemployment index, a poverty index, and the Townsend index of social deprivation. Statistical analyses were performed to quantitatively assess potential county-level associations between HIV/AIDS diagnosis rates and each of the three indexes of socioeconomic disadvantage.
Results: Ring maps revealed substantial spatial association in STD and HIV/AIDS diagnosis rates and highlighted large gender and racial disparities in HIV/AIDS across the state. The mean county-level HIV/AIDS diagnosis rate (per 100,000 population) was 24.2 for males vs. 11.2 for females, and 34.8 for African Americans vs. 5.2 for white people. In addition, ring map visualization suggested a county-level association between HIV/AIDS diagnosis rates and socioeconomic disadvantage. Significant positive bivariate relationships were found between HIV/AIDS rate categories and each increase in poverty index category (odds ratio [OR] = 2.03; p=0.006), as well as each increase in Townsend index of social deprivation category (OR=4.98; p<0.001). A multivariate ordered logistic regression model in which all three socioeconomic disadvantage indexes were included showed a significant positive association between HIV/AIDS and Townsend index categories (adjusted OR=6.10; p<0.001).
Conclusions: Ring maps graphically depicted the spatial coincidence of STD and HIV/AIDS and revealed large gender and racial disparities in HIV/AIDS across South Carolina counties. This spatial visualization method used existing data systems to highlight the importance of social determinants of health in program planning and decision-making processes.
Figures
References
-
- Centers for Disease Control and Prevention (US). Diagnoses of HIV infection and AIDS in the United States and dependent areas, 2009. Atlanta: CDC; 2011. [[cited 2011 Apr 5]]. Also available from: URL: http://www.cdc.gov/hiv/surveillance/resources/reports/2009report/index.htm.
-
- CDC (US). 2009 sexually transmitted disease surveillance. Atlanta: CDC; 2010. [[cited 2011 Apr 5]]. Also available from: URL: http://www.cdc.gov/std/stats09/default.htm.
-
- Department of Health and Human Services (US). Healthy People 2010. Washington: HHS; 2000. [[cited 2010 Apr 9]]. Also available from: URL: http://www.healthypeople.gov/2010/About/goals.htm.
-
- CDC (US). 2003–2008 HIV prevention community planning guidance. Atlanta: CDC; 2003. [[cited 2010 Apr 9]]. Also available from: URL: http://www.cdc.gov/hiv/topics/cba/resources/guidelines/hiv-cp/pdf/hiv-cp....
-
- Jenkins RA, Carey JW. Decision making for HIV prevention planning: organizational considerations and influencing factors. AIDS Behav. 2005;9(2 Suppl):S1–8. - PubMed
MeSH terms
LinkOut - more resources
Full Text Sources
Medical
Research Materials
