. 2012 Mar;68(1):1-11.
doi: 10.1111/j.1541-0420.2011.01654.x. Epub 2011 Aug 12.

A statistical framework for eQTL mapping using RNA-seq data

Affiliations

A statistical framework for eQTL mapping using RNA-seq data

Wei Sun. Biometrics. 2012 Mar.

Abstract

RNA-seq may replace gene expression microarrays in the near future. Using RNA-seq, the expression of a gene can be estimated using the total number of sequence reads mapped to that gene, known as the total read count (TReC). Traditional expression quantitative trait locus (eQTL) mapping methods, such as linear regression, can be applied to TReC measurements after they are properly normalized. In this article, we show that eQTL mapping, by directly modeling TReC using discrete distributions, has higher statistical power than the two-step approach: data normalization followed by linear regression. In addition, RNA-seq provides information on allele-specific expression (ASE) that is not available from microarrays. By combining the information from TReC and ASE, we can computationally distinguish cis- and trans-eQTL and further improve the power of cis-eQTL mapping. Both simulation and real data studies confirm the improved power of our new methods. We also discuss the design issues of RNA-seq experiments. Specifically, we show that by combining TReC and ASE measurements, it is possible to minimize cost and retain the statistical power of cis-eQTL mapping by reducing sample size while increasing the number of sequence reads per sample. In addition to RNA-seq data, our method can also be employed to study the genetic basis of other types of sequencing data, such as chromatin immunoprecipitation followed by DNA sequencing data. In this article, we focus on eQTL mapping of a single gene using the association-based method. However, our method establishes a statistical framework for future developments of eQTL mapping methods using RNA-seq data (e.g., linkage-based eQTL mapping), and the joint study of multiple genetic markers and/or multiple genes.


Figures

Figure 1
Figure 1
A diagram to illustrate the RNA-seq count variation of one gene due to an cis-eQTL. (a) RNA-seq measurements of a hypothetic gene with two exons in three diploid individuals. The target SNP which we test for association has the genotype CT, CC and TT for the three individuals. There is a SNP on the first exon, which has genotype AT, AT, and AA for the three individuals. Allele-specific expression can be measured by those sequence reads that overlap with a heterozygous exonic SNP. Therefore we can measure allele-specific expression for individuals (i) and (ii). However, association testing by ASE is only possible if the target SNP is heterozygous, thus only individual (i) can be used to test for eQTL by ASE (b) ASE measurments for individual (i). (c) Total Read Count (TReC) measured for the three individuals across the two exons of this gene.
Figure 2
Figure 2
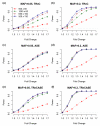
Comparison of the power of four methods for eQTL mapping when the MAF of the target SNP is 0.05 (a) or 0.2 (b). P-value cutoff of 0.05 is used to call significance and power is calculated as the percentage of simulations where the p-values are smaller than 0.05, among 2,000 simulations. The horizontal dash line at the bottom of each figure corresponds to a power of 0.05. When the fold change is 1.0, all methods’ power is approximately 0.05, which indicates that type I errors are controlled at a desired level by all methods.
Figure 3
Figure 3
Comparison of the powers of TReC, ASE, and TReCASE for eQTL mapping. “500 × 65” indicates the baseline situation that μAA = 500 and sample size N = 65. “1000 × 65”, “650 × 100” , and “500 × 130” indicate three strategies to improve power by increasing the number of reads per sample, increasing the sample size, or both. Similar to Figure 2, a p-value cut-off of 0.05 is used to call significance, and power is calculated as the percentage of simulations where the p-values are smaller than 0.05, among 2,000 simulations. The horizontal dash line at the bottom of each figure corresponds to a power of 0.05.
Figure 4
Figure 4
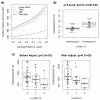
(a) The number of local-eQTLs identified across permutation p-value thresholds. For each gene, only the most significant local-eQTL is kept and all the other local-eQTLs are discarded. (b) An example of eQTL mapping by the ASE model. b(A/T) indicates the regression coefficient estimates from the ASE model and TReC model, respectively. (c) An example of eQTL mapping by the TReC model. The X-axis is the genotype measured by the number of minor alleles, and the Y-axis is the number of reads per sample. Adjustment means to include seven confounding variables into the TReC model: the total number of reads per sample plus 6 PCs.

References

    1. Benjamini Y, Hochberg Y. Controlling the false discovery rate: a practical and powerful approach to multiple testing. Journal of the Royal Statistical Society. Series B (Methodological) 1995;57:289–300.
    1. Brem RB, Yvert G, Clinton R, Kruglyak L. Genetic dissection of transcriptional regulation in budding yeast. Science. 2002;296:752–755. - PubMed
    1. Byrd R, Lu P, Nocedal J, Zhu C. A limited memory algorithm for bound constrained optimization. SIAM Journal on Scientific Computing. 1995;16:1190–1208.
    1. Chun H, Keles S. Expression Quantitative Trait Loci Mapping With Multivariate Sparse Partial Least Squares Regression. Genetics. 2009;182:79. - PMC - PubMed
    1. Cookson W, Liang L, Abecasis G, Moffatt M, Lathrop M. Mapping complex disease traits with global gene expression. Nature Reviews Genetics. 2009;10:184–194. - PMC - PubMed

Publication types