. 2011 Jul;50(4):445-53.

Ethics and animal numbers: informal analyses, uncertain sample sizes, inefficient replications, and type I errors

Affiliations

Ethics and animal numbers: informal analyses, uncertain sample sizes, inefficient replications, and type I errors

Douglas A Fitts. J Am Assoc Lab Anim Sci. 2011 Jul.

Abstract

To obtain approval for the use vertebrate animals in research, an investigator must assure an ethics committee that the proposed number of animals is the minimum necessary to achieve a scientific goal. How does an investigator make that assurance? A power analysis is most accurate when the outcome is known before the study, which it rarely is. A 'pilot study' is appropriate only when the number of animals used is a tiny fraction of the numbers that will be invested in the main study because the data for the pilot animals cannot legitimately be used again in the main study without increasing the rate of type I errors (false discovery). Traditional significance testing requires the investigator to determine the final sample size before any data are collected and then to delay analysis of any of the data until all of the data are final. An investigator often learns at that point either that the sample size was larger than necessary or too small to achieve significance. Subjects cannot be added at this point in the study without increasing type I errors. In addition, journal reviewers may require more replications in quantitative studies than are truly necessary. Sequential stopping rules used with traditional significance tests allow incremental accumulation of data on a biomedical research problem so that significance, replicability, and use of a minimal number of animals can be assured without increasing type I errors.


Figures

Figure 1.
Figure 1.
Power as a function of effect size d (difference between means divided by standard deviation) for different total sample sizes in a 2-tailed t test with 2 independent groups and α = 0.05. If an effect of 1 SD is the smallest interesting effect, designing the experiment to detect this effect with high power, such as 99%, can waste animals, because the test continues to detect trivial effects, such as 0.5, with a high frequency (56%). Setting a power of 80% for the smallest interesting effect causes the detection of trivial effects to decline more steeply. Both tests have high power for detecting relatively larger effects, such as 1.5 SD.
Figure 2.
Figure 2.
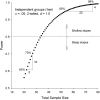
Power as a function of total sample size. A power of 0.8 is the approximate point where the addition of each individual subject begins to add less power to the test. An increase of power from approximately 60% to 70% requires only 5 subjects, whereas an increase from 95% to 99% requires 22 subjects. d, difference between means divided by standard deviation.
Figure 3.
Figure 3.
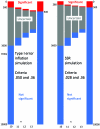
Frequency of errors during sequential testing when the null hypothesis is true. (Left) The areas of the bars are proportional to the number of 10,000 simulated experiments that were significant (less than 0.05), not significant (greater than 0.36), or uncertain (between 0.05 and 0.36) after a t test with the null hypothesis true. The leftmost bar includes all 10,000 experiments conducted with n = 10. According to the fixed stopping rule, experiments should always be stopped after this first test when the proportion of type I errors equals alpha (0.05). Instead, one subject then was added to all experiments in the uncertain region, and the test was redone after n = 11, n = 12, and n = 13. The fifth bar shows the final decision on all 10,000 experiments. The addition of subjects to experiments in the uncertain region increased the actual rate of Type I errors by 69% from 0.05 to 0.0846 because each successive test included new errors. (Right) An SSR approach using criteria of 0.028 and 0.36 instead of 0.05 and 0.36. The SSR assumes that new subjects will be added to uncertain experiments. Sequential testing of the uncertain region at the 0.028-level produces an error rate of 0.05 for all experiments. The use of a criterion less than 0.05 compensates for the inflation of alpha and allows one to use sequential testing with an overall α = 0.05. The individual criteria are specific to the desired sample sizes and can be determined from a published table.

References

    1. Botella J, Ximenez C, Revuelta J, Suero M. 2006. Optimization of sample size in controlled experiments: the CLAST rule. Behav Res Methods 38:65–76 - PubMed
    1. Cohen J. 1988. Statistical power analysis for the behavioral sciences, 2nd ed. Hillsdale (NJ): Erlbaum
    1. Cumming G. 2005. Understanding the average probability of replication: comment on Killeen (2005). Psychol Sci 16:1002–1004 - PubMed
    1. Dell RB, Holleran S, Ramakrishnan R. 2002. Sample size determination. ILAR J 43:207–213 - PMC - PubMed
    1. Desbiens NA. 2003. A novel use for the word ‘trend’ in the clinical trial literature. Am J Med Sci 326:61–65 - PubMed

LinkOut - more resources