. 2011 Dec;51(6):885-93.
doi: 10.1016/j.yjmcc.2011.07.023. Epub 2011 Aug 2.

Mitofusins are required for angiogenic function and modulate different signaling pathways in cultured endothelial cells

Affiliations

Mitofusins are required for angiogenic function and modulate different signaling pathways in cultured endothelial cells

Jesse J Lugus et al. J Mol Cell Cardiol. 2011 Dec.

Abstract

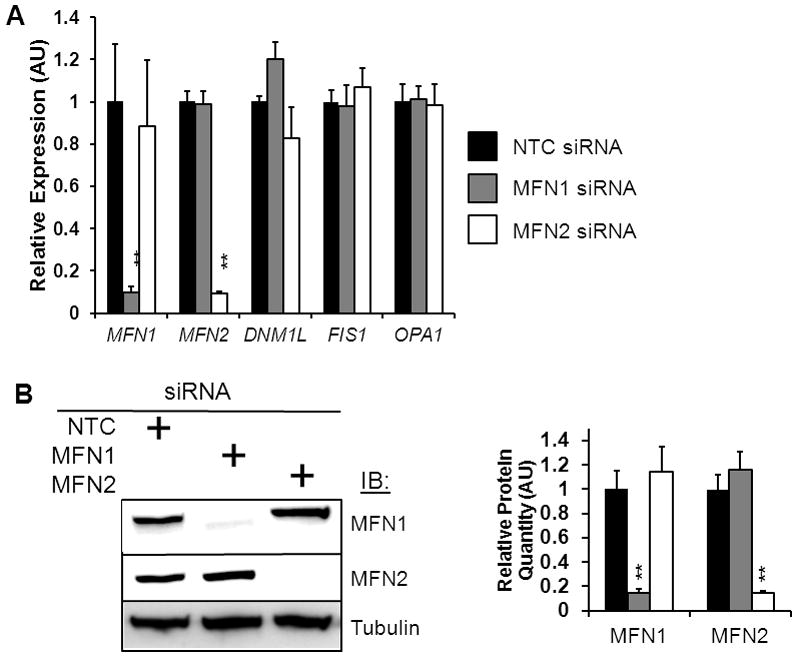
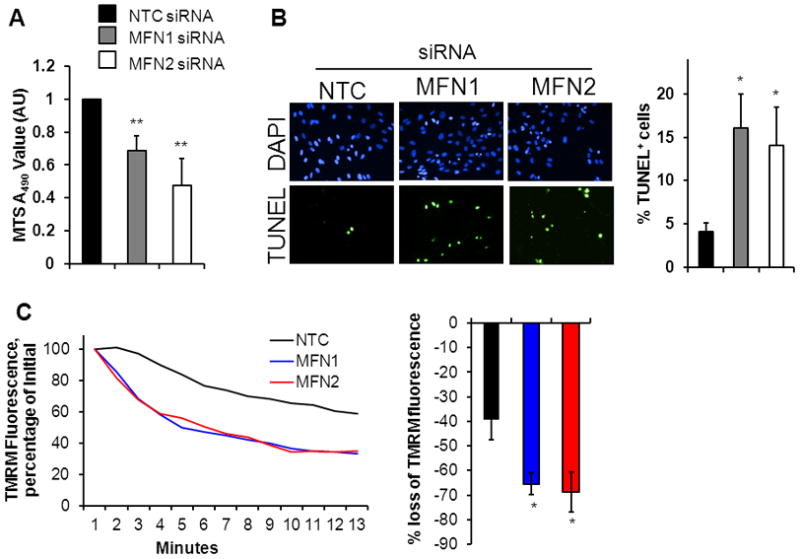
The mitofusin proteins MFN1 and MFN2 function to maintain mitochondrial networks by binding one another and initiating outer mitochondrial membrane fusion. While it has recently been recognized that vascular endothelial cells rely upon mitochondria as signaling rather than energy-producing moieties, the role of mitochondrial dynamics in endothelial cell function has not been addressed. To begin to understand what role mitochondrial dynamics play in this context, we examined the regulation of MFN1 and MFN2 and the consequences of siRNA-mediated knockdown of these proteins in cultured endothelial cells. Treatment with VEGF-A led to the upregulation of MFN2 and, to a lesser extent, MFN1. Knockdown of either MFN led to disrupted mitochondrial networks and diminished mitochondrial membrane potential. Knockdown of either MFN decreased VEGF-mediated migration and differentiation into network structures. MFN ablation also diminished endothelial cell viability and increased apoptosis under low mitogen conditions. Knockdown of MFN2 uniquely resulted in a decrease in the generation of reactive oxygen species as well as the blunting of the gene expression of components of the respiratory chain and transcription factors associated with oxidative metabolism. In contrast, ablation of MFN1 led to the selective reduction of VEGF-stimulated Akt-eNOS signaling. Taken together, our data indicate that mitochondrial dynamics, particularly those mediated by the mitofusins, play a role in endothelial cell function and viability.


Figures

Figure 1
Figure 1. MFNs are induced by VEGF
A) Copy number assessment of MFN1 and MFN2 in unstimulated HUVEC. B) Western blot examining the relationship between VEGF-signaling and mitofusin proteins. HUVEC were serum-starved for 16 hours and then treated with 30 ng/ml VEGF-A for the time period indicated. Graphs below blots are summary data from 4 independent experiments. *P < 0.05 vs. starved cells.
Figure 2
Figure 2. Depletion of MFN1 or MFN2 results in disrupted mitochondrial morphology in HUVEC
A) Expression of the Fus-Fis genes by qRT-PCR. All genes were normalized against the ribosomal gene RPLP0. The expression of a given gene under NTC siRNA was normalized as ‘1’. n = 5. B) Immunoblots on samples from A) examining protein levels of MFN1 and MFN2. Right panel is quantification of protein levels from 5 different experiments. **P < 0.005 vs. NTC siRNA. n = 5. C) Deconvolution microscopy of HUVEC treated with various siRNAs and visualized with 50 nM Mitotracker Green vital dye. D) Summary data of mitochondrial morphology measuring the aspect ratio and form factor of individual mitochondria from >13 cells. *P < 0.05, **P < 0.005 vs. NTC siRNA.
Figure 3
Figure 3. MFNs are required for proper angiogenic function of HUVEC in vitro
A) Representative results from in vitro tube formation assays plating 5 × 10⁴ HUVEC on Matrigel-coated wells and differentiating for 16–18 hours in the presence of 20 ng/ml VEGF. B) Quantification of tube/network formation from in vitro tube formation assays (n = 4). C) Measurement of cell migration using a modified Boyden chamber assay. Number indicates cells that migrated through a fibronectin-coated transwell insert in response to 20 ng/μl VEGF-A (n = 5). *P < 0.05, **P < 0.005 vs. NTC siRNA.
Figure 4
Figure 4. Attenuation of MFN1 or MFN2 in HUVEC compromises cell viability
A) Decreased cell viability when MFNs are knocked down in HUVEC as assessed by utilizing an MTS-based assay (n = 6). B) Detection of apoptotic cell death with TUNEL staining. Upper panels are cells stained with DAPI to label all nuclei. Lower panels are images of cells probed with an antibody against dsDNA breaks. Graph to right is quantification of percentage of TUNEL positive cells. C) Oxidative stress-induced loss of TMRM fluorescence. Graph to right is quantification of cumulative loss of TMRM fluorescence over 12 minutes. *P < 0.05, **P < 0.005 versus NTC siRNA.
Figure 5
Figure 5. Attenuation of MFN1 or MFN2 in HUVEC results in altered mitochondrial function
A) Quantitation of mtDNA:nDNA ratio by qPCR using primers specific for MTCO1 and LPL, respectively (n = 5). B) Measurement of ATP concentration. ATP is normalized to total cellular protein (n = 4). C) Measurement of mitochondrial membrane potential using the vital dye JC-1. Measurement is a normalized ratio of red to green fluorescence (n = 5). D) Measurement of ROS in unstimulated (starved) cells. Y-axis indicates the relative DCF fluorescence level. E) Detection of cellular ROS species by flow cytometry. The X-axis is DCF fluorescence (log scale) and Y-axis is event count. Panel to right is summary data of flow cytometry experiments (n = 4, >10,000 viable cells were analyzed per condition). *P < 0.05, **P < 0.005 versus NTC siRNA, #P < 0.05 vs. MFN1 knock-down.
Figure 6
Figure 6. Altered signaling and NO biogenesis when MFNs are knocked down in HUVEC
A) Cells were treated with respective siRNA oligos, serum starved overnight and stimulated with 100 μM H2O2 for 30 minutes and then the lysates subject to western blotting. Graph below blot summarizes data from 5 independent experiments. B) Cells were treated with respective siRNA oligos, serum starved overnight and stimulated with 50 ng/ml VEGF-A for 10 minutes and then the lysates subject to western blotting. Graph below blot summarizes data from 4 independent experiments. C) Cells were treated with respective siRNA oligos, serum starved overnight and stimulated with 50 ng/ml VEGF-A for 10 minutes and then the lysates utilized in a cGMP ELISA. Total cGMP was normalized to cellular protein (n = 4). *P < 0.05 vs. control (non-treated).

References

    1. Fraisl P, Mazzone M, Schmidt T, Carmeliet P. Regulation of angiogenesis by oxygen and metabolism. Devel Cell. 2009;16:167–79. - PubMed
    1. van der Vusse GJ, van Bilsen M, Glatz JF. Cardiac fatty acid uptake and transport in health and disease. Cardiovasc Res. 2000;45:279–93. - PubMed
    1. Cleaver O, Melton DA. Endothelial signaling during development. Nat Med. 2003;9:661–8. - PubMed
    1. Risau W. Mechanisms of angiogenesis. Nature. 1997;386:671–4. - PubMed
    1. Kanda T, Brown JD, Orasanu G, Vogel S, Gonzalez FJ, Sartoretto J, et al. PPARgamma in the endothelium regulates metabolic responses to high-fat diet in mice. J Clin Invest. 2009;119:110–24. - PMC - PubMed

Publication types

MeSH terms

Substances