. 2011 Oct 10;10(10):1003-13.
doi: 10.1016/j.dnarep.2011.07.006. Epub 2011 Aug 12.

The PARP inhibitor PJ34 causes a PARP1-independent, p21 dependent mitotic arrest

Affiliations

The PARP inhibitor PJ34 causes a PARP1-independent, p21 dependent mitotic arrest

Dana L Madison et al. DNA Repair (Amst). .

Abstract

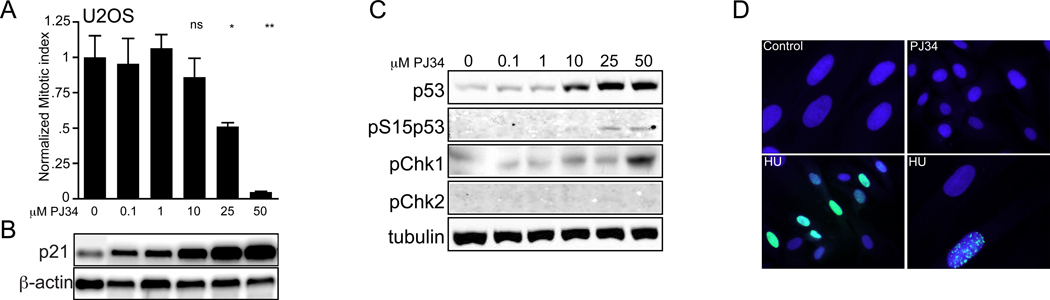
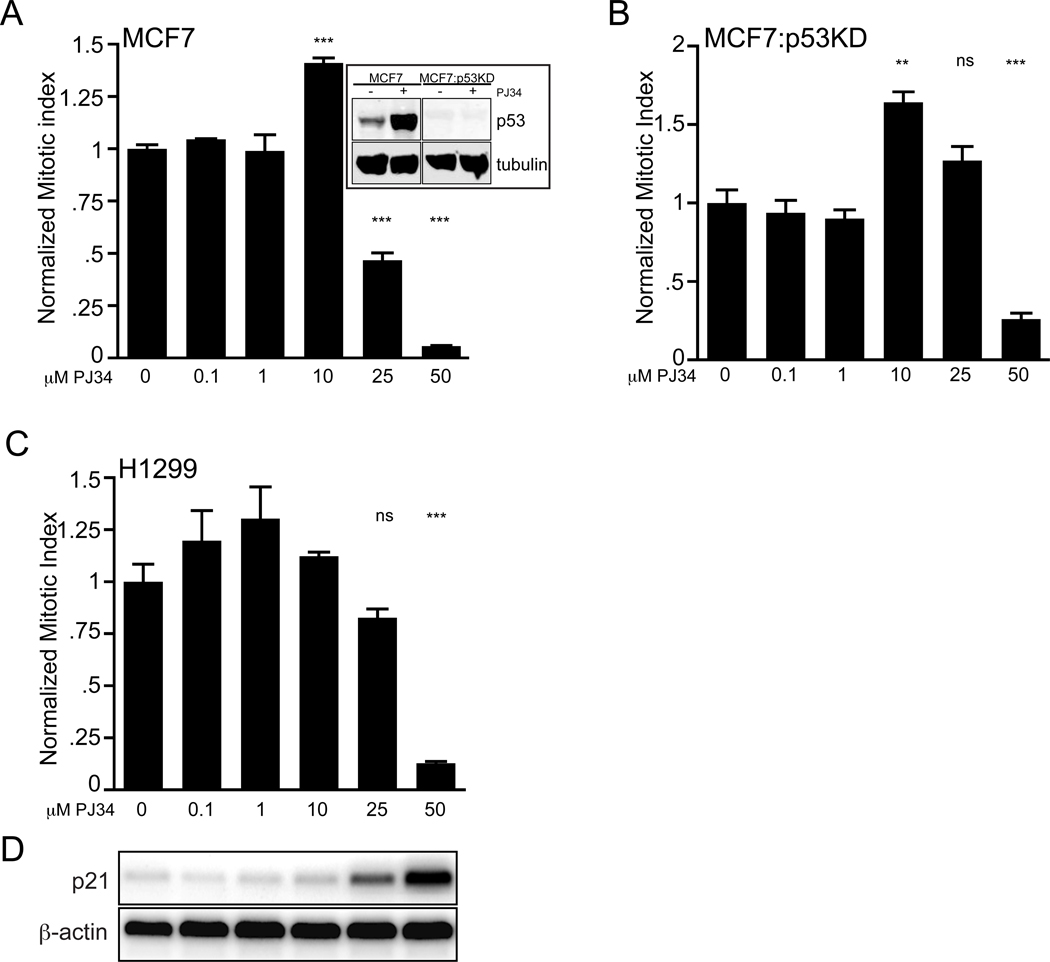
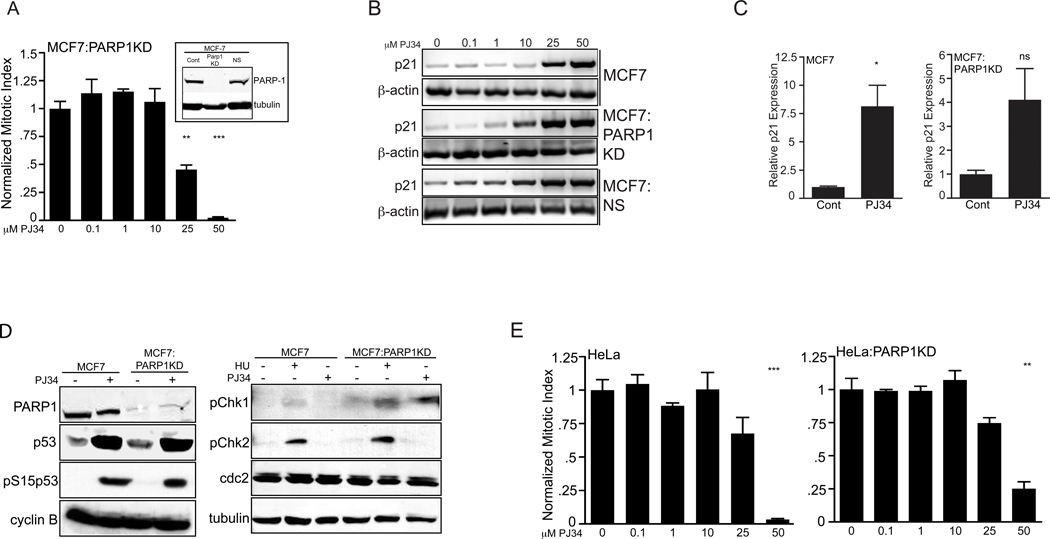
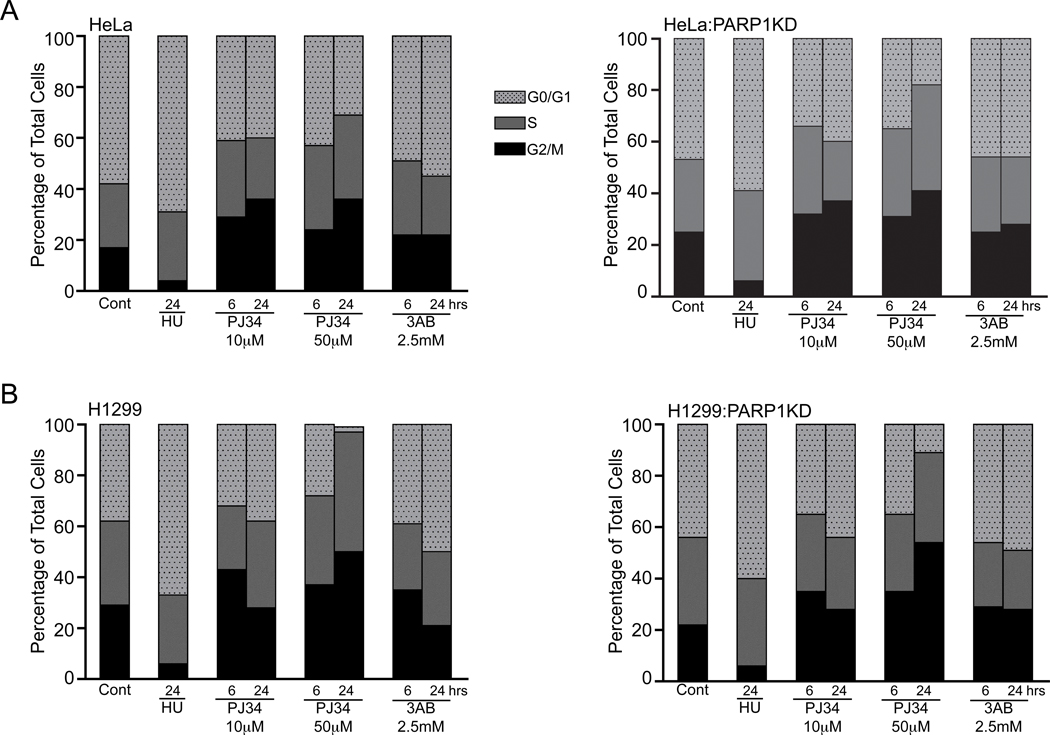
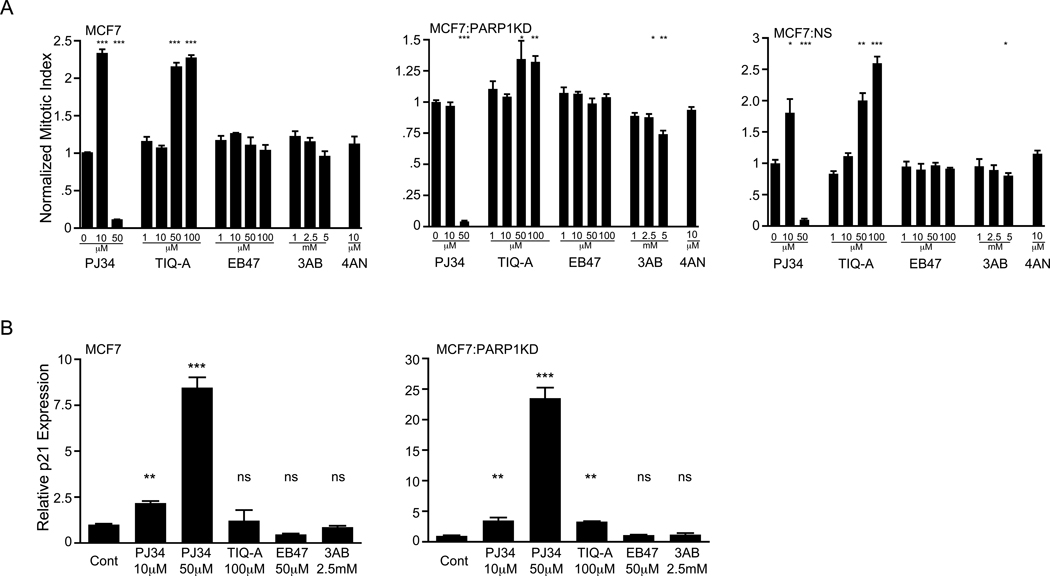
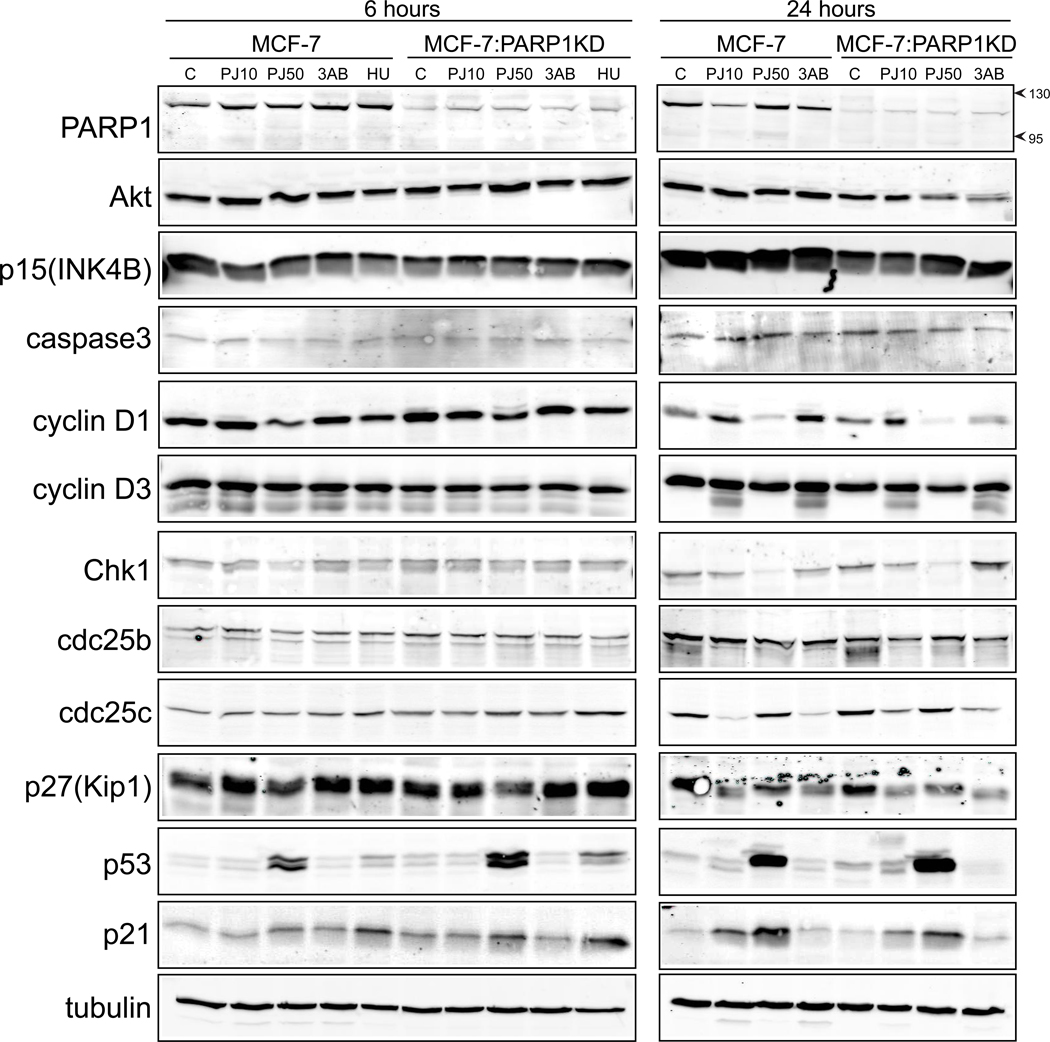
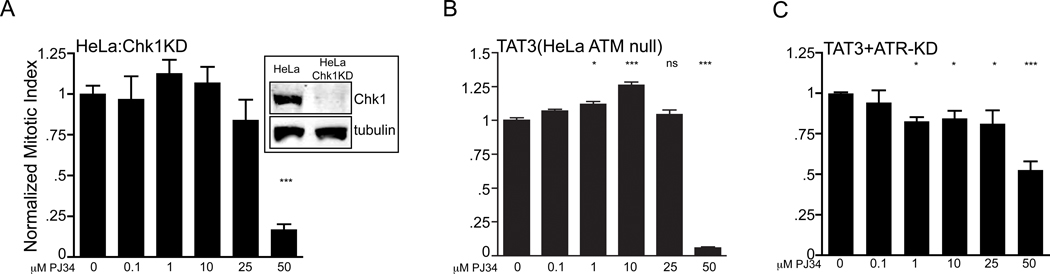
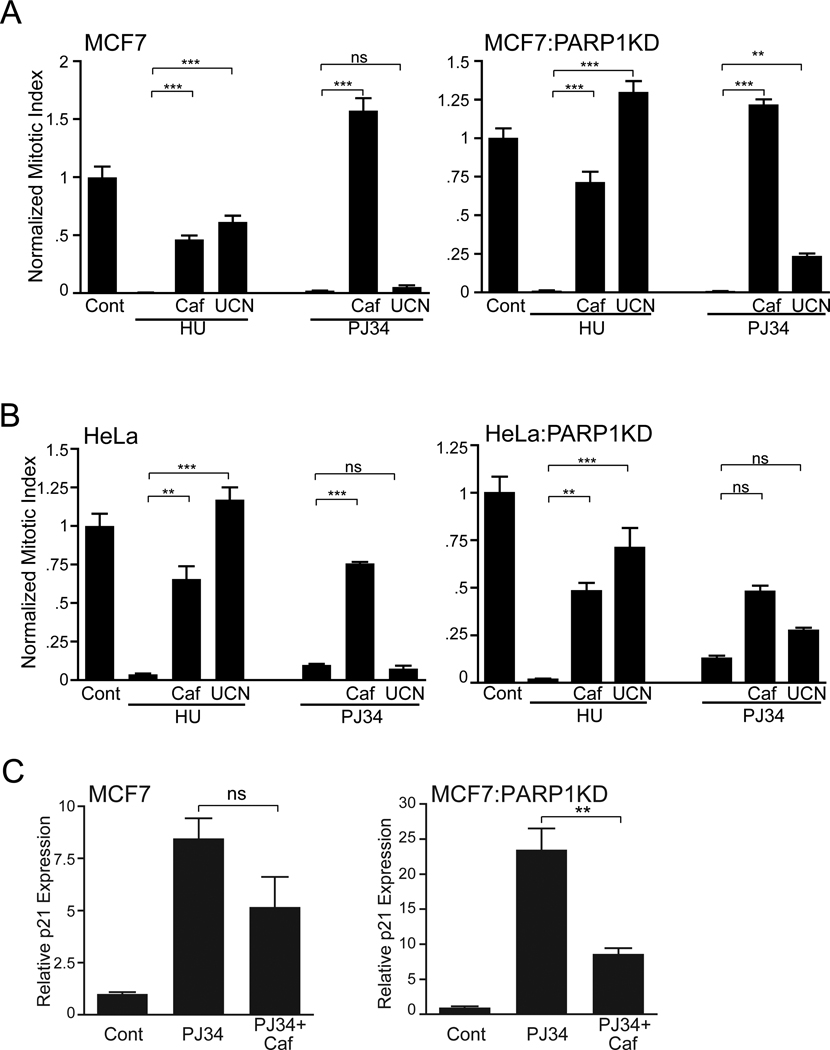
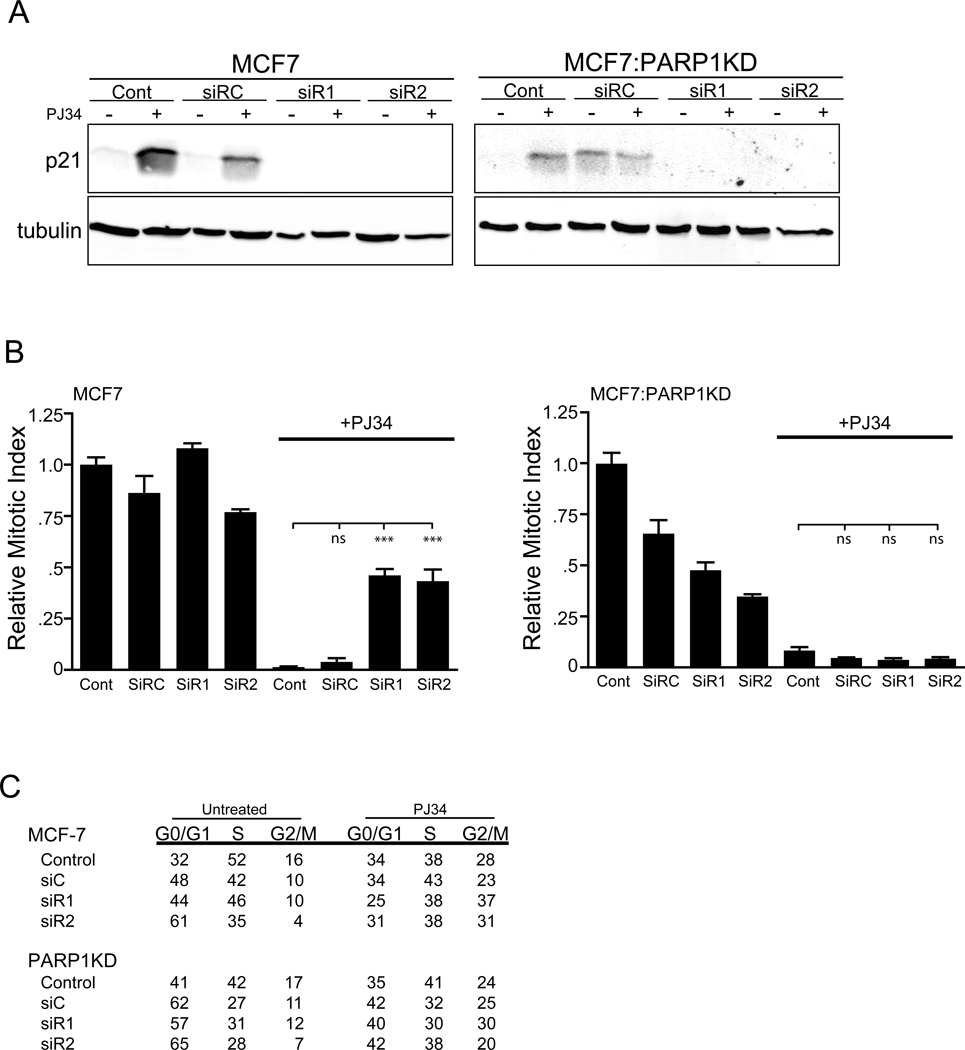
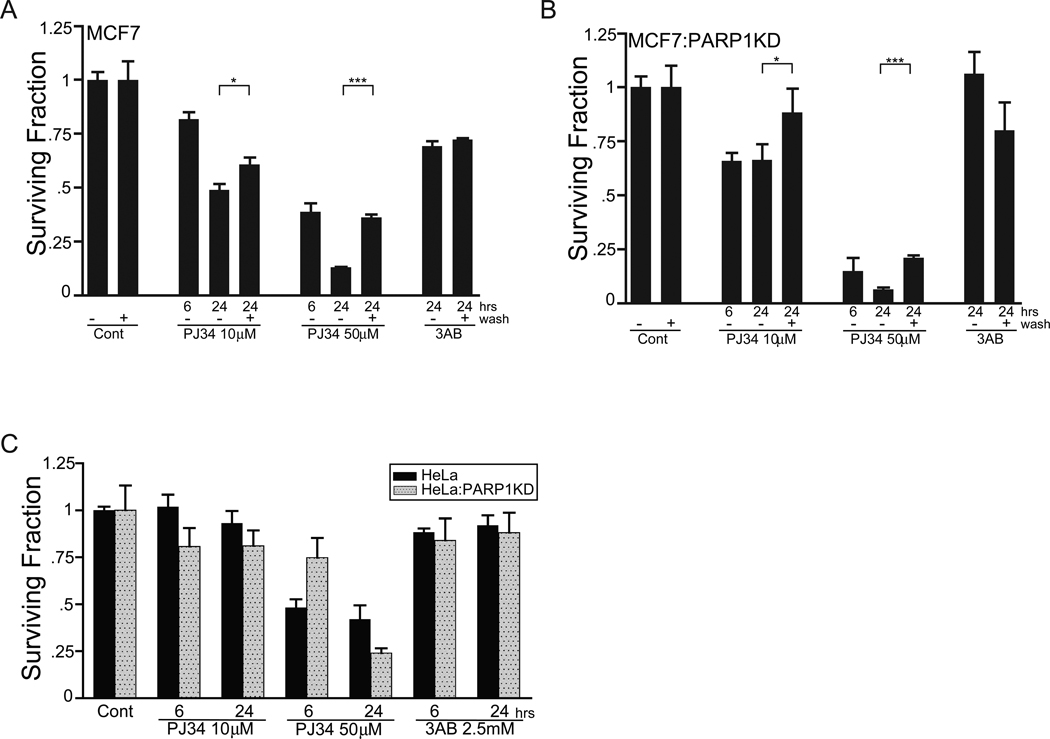
Poly(ADP)-ribose polymerase (PARP) inhibitors modify the enzymatic activity of PARP1/2. When certain PARP inhibitors are used either alone or in combination with DNA damage agents they may cause a G2/M mitotic arrest and/or apoptosis in a susceptible genetic context. PARP1 interacts with the cell cycle checkpoint proteins Ataxia Telangectasia Mutated (ATM) and ATM and Rad3-related (ATR) and therefore may influence growth arrest cascades. The PARP inhibitor PJ34 causes a mitotic arrest by an unknown mechanism in certain cell lines, therefore we asked whether PJ34 conditionally activated the checkpoint pathways and which downstream targets were necessary for mitotic arrest. We found that PJ34 produced a concentration dependent G2/M mitotic arrest and differentially affected cell survival in cells with diverse genetic backgrounds. p53 was activated and phosphorylated at Serine15 followed by p21 gene activation through both p53-dependent and -independent pathways. The mitotic arrest was caffeine sensitive and UCN01 insensitive and did not absolutely require p53, ATM or Chk1, while p21 was necessary for maintaining the growth arrest. Significantly, by using stable knockdown cell lines, we found that neither PARP1 nor PARP2 was required for any of these effects produced by PJ34. These results raise questions and cautions for evaluating PARP inhibitor effectiveness, suggesting whether effects should be considered not only on PARP's diverse ADP-ribosylation independent protein interactions but also on homologous proteins that may be producing either overlapping or distinct effect.


Conflict of interest statement

Conflict of Interest: The authors declare no conflicts of interest.

Figures

Figure 1
Figure 1
PJ34 induces a dose dependent mitotic arrest, activating both p53 and p21. (A) A normalized mitotic index plotted as a ratio of (% phospho-H3 signal / tubulin), graphed relative to untreated, growth phase controls in U2OS cells treated with increasing PJ34 concentrations for 24 hours. Graphed is a single, representative experiment with triplicate samples showing a significant reduction in pH3 positive mitotic nuclei with 25 (*p=0.04) and 50 µM PJ34 (**p=0.003) compared to untreated cells (Cont) (error bars, SEM; ns = not significant). (B) Semi-quantitative PCR and ethidium gel electrophoresis for p21 and β-actin control on parallel treated U2OS cells. (C) Western blots on PJ34 treated U2OS cells for the indicated proteins. pChk1 = phospho(Serine345)-Chk1, pChk2 = phospho(Threonine68)-Chk2, pS15p53 = phospho(serine15)-p53. Tubulin is shown as a loading control. (D) Indirect immunofluorescence for γ-H2A.X with DAPI nuclear co-staining in HSF cells treated with 50 µM PJ34 (24 hours) or 10 mM HU (18 hours). The images are merged; anti-γ-H2A.X staining (green) is seen in most HU treated nuclei (blue), but not in PJ34 treated cells. Higher power magnification shows the γ-H2A.X positive foci (lower right panel).
Figure 2
Figure 2
PJ34 cell cycle arrest does not require p53. (A) Inset, western blot for p53 showing both the parent MCF7 and the lentiviral shRNA MCF7 p53-knockdown (MCF7:p53KD) cell lines with p53 activation by 50 µM PJ34 in MCF7 cells alone. Tubulin is shown as a loading control. (A, B, C) Cell cycle arrest in MCF7, MCF7:p53KD and H1299 cell lines treated with PJ34 (24 hrs) and the data plotted as a normalized mitotic index as in (Fig. 1(A)). Representative triplicate experiments for (A) MCF7 (relative to untreated cells, ***p<0.002), (B) MCF7:p53KD (**p=0.004; *** p =0.001) or (C) H1299 cells (***p<0.001) are shown; error bars, SEM. (D) Semi-quantitative PCR for p21 and β-actin control on parallel PJ34 treated H1299 cultures.
Figure 3
Figure 3
PARP1 is not required for PJ34 induced mitotic arrest. (A) Growth arrest from PJ34 treated (24 hrs) MCF7:PARP1KD cells plotted as a normalized mitotic index from a single representative triplicate experiment; error bars, SEM. Inset, western blot for PARP1 and tubulin loading control for MCF7 (Cont), MCF7:PARP1KD, and MCF7:NS (non-specific shRNA lentivirus) cell lines. Relative to untreated cells, **p=0.002, ***p<0.001. (B) Semi-quantitative PCR of p21 and β-actin control on parallel PJ34 treated (24 hrs) samples in MCF7, MCF7:PARP1KD and MCF7:NS cell lines. (C) Real-time PCR in MCF7 and MCF7:PARP1KD cells for p21 and β–actin in control (untreated, growth phase) and 50 µM PJ34 treated cells (6 hrs; MCF7 (*p=0.01), MCF7:PARP1KD (p=0.07)). The quantitative data are graphed as the relative, normalized target gene expression in the low exponential range. A single representative experiment on triplicate, parallel treated samples is shown. Error bars, SEM. (D) Western blots for the proteins indicated at left treated with either 50 µM PJ34 for 24 hrs or 10 mM HU for 4 hrs. Abbreviations are as in Fig. 1(C). Tubulin is shown as a loading control. (E) Mitotic arrest in PJ34 treated HeLa and HeLa:PARP1KD cells plotted as a normalized mitotic index from a single representative triplicate experiment. HeLa 25 µM p=0.08, 50 µM ***p<0.001; HeLaPARP1KD 25 µM p=0.06, 50 µM **p=0.002 ; error bars, SEM.
Figure 4
Figure 4
Cell cycle distributions determined by FACS analysis in response to 10mM hydroxyurea (HU), PJ34 and 3-aminobenzamide (3AB) in (A) HeLa and HeLa:PARP1KD and (B) H1299 and H1299:PARP1KD cell lines treated for the time and at the concentrations indicated and graphed as a percentage of total cells for each phase.
Figure 5
Figure 5
PJ34 caused the most significant mitotic arrest amongst 5 tested PARP inhibitors. (A) Normalized mitotic index in PARP inhibitor treated MCF7, MCF7:PARP1KD and MCF7:NS cells (24 hours) from a single representative, triplicate experiment in parallel treated cultures; error bars, SEM. MCF7 (***p<0.001). MCF7:PARP1KD PJ34 50 µM (***p<0.001), TIQ 50 µM (*p=0.05) and 100 µM (**p=0.003), 3AB 2.5mM (*p=0.02) and 5 mM (**p=0.001). MCF7:NS PJ34 10 µM (*p<0.02) and 50 µM (***p<0.001), TIQ 50 µM (**p<0.002) and 100 µM (***p<0.001), 3AB 5 mM (*p=0.05). (B) Real-time PCR in triplicate parallel cultured MCF7 and MCF7:PARP1KD cells for p21 and β–actin in control (untreated, growth phase) and PARP inhibitor treated cells at the indicated concentrations (note the scale differences). The data were acquired and plotted as in Fig. 3(C) compared relative to the controls (ns = not significant, ** p<0.01, *** p<0.001). Error bars, SEM.
Figure 6
Figure 6
Western blots in MCF7 and MCF7:PARP1KD cells for checkpoint pathway proteins. The cells were treated with 10 mM hydroxyurea (HU), 10 µM PJ34 (PJ10), 50 µM PJ34 (PJ50) or 2.5 mM 3-aminobenzamide (3AB) for either 6 or 24 hours and analyzed for the proteins at the left. Arrows on the PARP1 blot indicate Mr to show no significant appearance of the 85kDa PARP cleavage product.
Figure 7
Figure 7
ATR is necessary but ATM and Chk1 are not required for PJ34 induced mitotic arrest. A normalized mitotic index plotted from a single representative triplicate experiment with PJ34 treated (A) HeLa:Chk1KD, (B) TAT3 (HeLa:ATM null) or (C) TAT3:ATR-KD cells (ATMnull+ATRsiRNA, clone 19 [34]); error bars, SEM. Inset, western blot for Chk1 and tubulin showing the Chk1 knockdown. HeLa:Chk1KD PJ34 50 µM (***p<0.001); TAT3 PJ34 1 µM (*p=0.01), PJ34 10 µM (***p<0.001), PJ34 50 µM (***p<0.001); TAT3:ATR-KD (*p<0.03; ***p<0.001).
Figure 8
Figure 8
Caffeine but not UCN01 abrogated PJ34 growth arrest and was not dependent upon PARP1 while a HU growth arrest was abrogated by both caffeine and UCN01 without dependence upon PARP1. A normalized mitotic index from a single representative triplicate experiment is shown. (A) MCF7 and MCF7:PARP1KD cells were analyzed in growth phase (Cont) or treated with HU (10 mM) or 50 µM PJ34 alone or with the addition of either caffeine or UCN01 for 24 hrs. (***p<0.0003; **p<0.001) (B) HeLa and HeLa:PARP1KD cells analyzed as in (A) (***p<0.0004; **p<0.002; ns – not significant); error bars, SEM. (C) MCF7 and MCF7:PARP1KD cells were treated as in (8 (A)) and analyzed by real-time PCR for p21 and β–actin in control, PJ34 or PJ34+caffeine treated cells. The data are plotted and analyzed as in Fig 3(C). PJ34+caf compared to PJ34 alone (MCF7, p=0.13; MCF7:PARP1KD, p= 0.008).
Figure 9
Figure 9
Elimination of PJ34 activated p21 expression attenuates growth arrest. (A) Western blot for p21 and tubulin loading control in MCF7 and MCF7:PARP1KD cells untreated (Cont), transfected with either a non-specific siRNA (siRC), or siRNAs against p21 (siR1, siR2) for 18 hours followed by treatment with (+) or without (−) 50 µM PJ34 for 24 hours. (B) Normalized mitotic index plotted from parallel cultures treated as in (9 (A)). A single representative triplicate experiment is shown for Control or siRNA transfected cultures with (+) or without (−) 50 µM PJ34. Error bars, SEM (ns = not significant, ***p<0.001). (C) FACS analysis on parallel treated cultures from (9 (A)). The table shows the percentage of total cells represented in G0/G1, S or G2/M in either MCF7 or MCF7:PARP1KD cells.
Figure 10
Figure 10
PJ34 exposure is conditionally lethal. (A) MCF7 or (B) MCF7:PARP1KD cells were treated for 6 or 24 hours with either 10 or 50 µM PJ34 or 2.5 mM 3AB as a negative control and a clonegenic survival assay performed. One set of samples received a media wash and 24-hour recovery period (+ wash) following treatment and prior to harvesting and re-plating. Data are plotted as a ratio of colonies/plated cells compared to the plating efficiency for the control condition and are representative triplicate, parallel treated samples from a single experiment performed at least twice. Error bars, SEM, (* = p<0.05; *** p<0.001). (C) HeLa (solid bars) and HeLa:PARP1KD (stippled bars) cells were treated for 6 or 24 hours with PJ34 or 3AB as shown and a clonegenic survival assay performed as in 10(A, B).

References

    1. Schreiber V, Amé JC, Dollé JC, Schultz I, Rinaldi B, Fraulob V, Ménissier-de Murcia J, de Murcia G. Poly(ADP-ribose) polymerase-2 (PARP-2) is required for efficient base excision DNA repair in association with PARP-1 and XRCC1. J. Biol. Chem. 2002;277:23028–23036. - PubMed
    1. Kraus WL. Transcriptional control by PARP-1: chromatin modulation, enhancer binding, co-regulation and insulation. Curr. Opin. Cell Biol. 2008;20:294–302. - PMC - PubMed
    1. Rouleau M, Patel A, Hendzel MJ, Kaufmann SH, Poirier GG. PARP inhibition: PARP1 and beyond. Nat. Rev. Cancer. 2010;10:293–300. - PMC - PubMed
    1. Farmer H, McCabe N, Lord CJ, Tutt AN, Johnson DA, Richardson TB, Santarosa M, Dillon KJ, Hickson I, Knights C, Martin NM, Jackson SP, Smith GC, Ashworth A. Targeting the DNA repair defect in BRCA mutant cells as a therapeutic strategy. Nature. 2005;434:917–921. - PubMed
    1. Bryant H, Schultz N, Thomas HD, Parker KM, Flower D, Lopez E, Kyle S, Meuth M, Curtin NJ, Helleday T. Specific killing of BRCA2-deficient tumours with inhibitors or poly(ADP-ribose) polymerase. Nature. 2005;434:913–917. - PubMed

Publication types

MeSH terms

Substances