. 2011 Aug 16;20(2):143-57.
doi: 10.1016/j.ccr.2011.07.007.

Delineation of two clinically and molecularly distinct subgroups of posterior fossa ependymoma

Affiliations

Delineation of two clinically and molecularly distinct subgroups of posterior fossa ependymoma

Hendrik Witt et al. Cancer Cell. .

Abstract

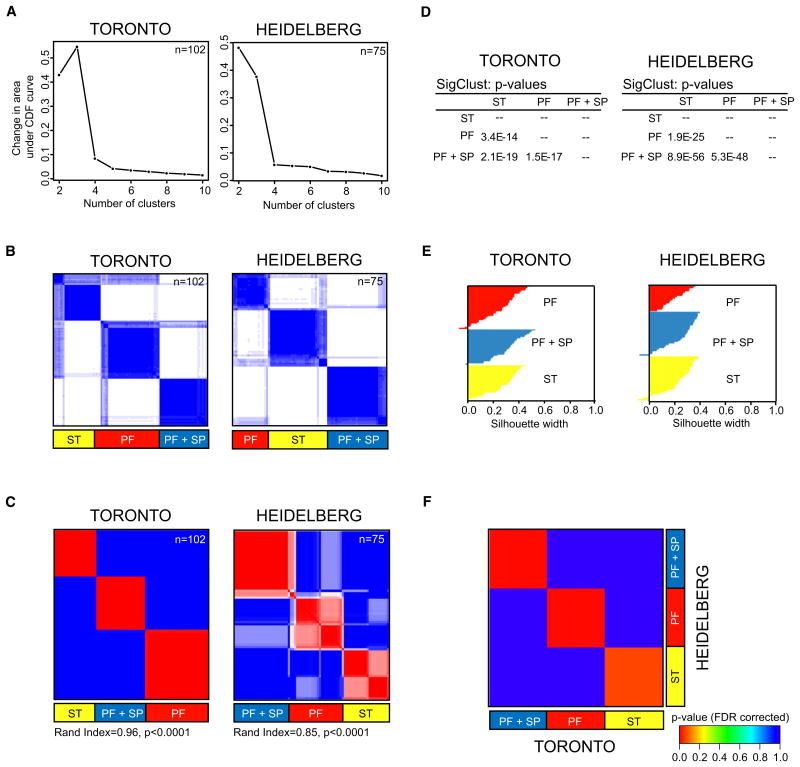
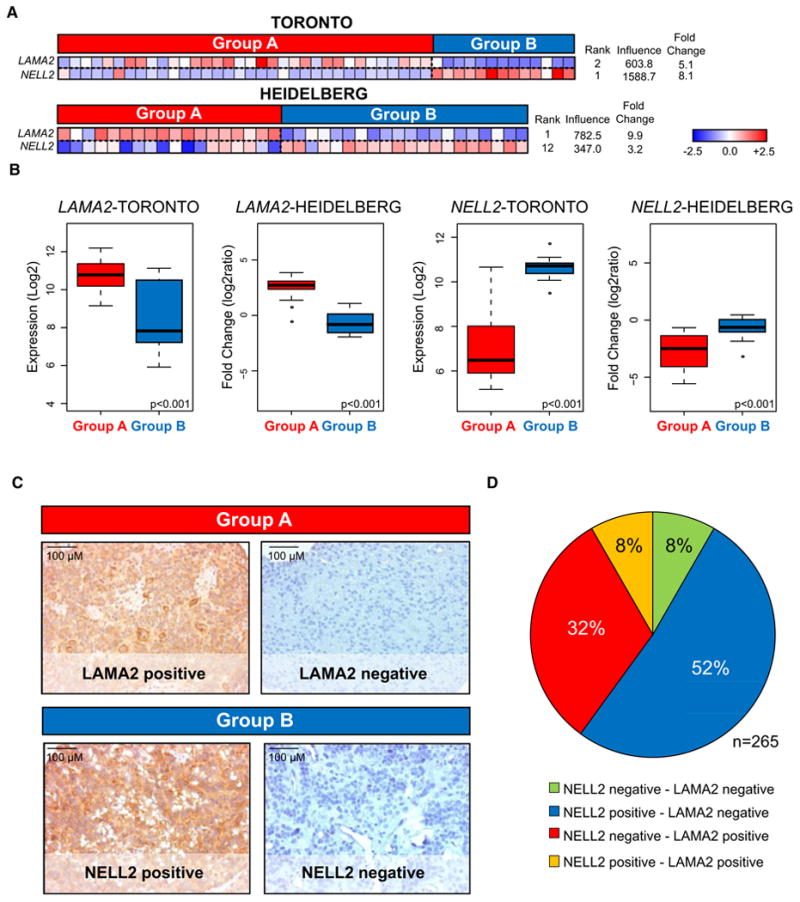
Despite the histological similarity of ependymomas from throughout the neuroaxis, the disease likely comprises multiple independent entities, each with a distinct molecular pathogenesis. Transcriptional profiling of two large independent cohorts of ependymoma reveals the existence of two demographically, transcriptionally, genetically, and clinically distinct groups of posterior fossa (PF) ependymomas. Group A patients are younger, have laterally located tumors with a balanced genome, and are much more likely to exhibit recurrence, metastasis at recurrence, and death compared with Group B patients. Identification and optimization of immunohistochemical (IHC) markers for PF ependymoma subgroups allowed validation of our findings on a third independent cohort, using a human ependymoma tissue microarray, and provides a tool for prospective prognostication and stratification of PF ependymoma patients.


Figures

Figure 1
Figure 1. Identification of Three Primary Molecular Classes of Ependymoma
(A) Area under empirical cumulative distribution plots (k = 2 to k = 10), generated from consensus hierarchical clustering of 102 Toronto and 75 Heidelberg samples identifies strongest statistical support for the existence of three primary subgroups of ependymoma. (k denotes the number of clusters) (B) Consensus HCL heatmaps displaying the three robust subgroups of ependymoma defined by gene expression. (C) Consensus NMF of 102 Toronto and 75 Heidelberg samples at k = 3 demonstrates significant concordance with the consensus HCL subgroup classification. Significance of similarity was determined by a Rand index and permutation testing of the Toronto sample labels (see experimental procedures). (D) Significance of HCL subgroup classifications in both datasets determined by pairwise comparisons between all clusters using SigClust. (E) Silhouette analysis identifies “core” samples defined as tumors with positive silhouette values. (F) Submap analysis demonstrates that the HCL-defined clusters identified in the Toronto cohort are nearly identical to the HCL-defined clusters defined in the Heidelberg cohort. Significance of similarity measured by FDR-corrected p value. See also Figure S1.
Figure 2
Figure 2. Transcriptome Analysis Distinguishes Two Distinct Subgroups of Posterior Fossa Ependymoma
(A) Graphical illustration of global differences between the transcriptomes of Group A and Group B PF ependymomas determined by principal component analysis. Individual tumor samples are represented as spheres, (red = Group A, blue = Group B) and ellipsoids display two standard deviations around each subgroup. (B) Heatmap of the top 100 most discriminating genes between Group A and Group B ependymomas, in both datasets, as calculated by Goeman's Global Test statistic. (C) Box plots demonstrating the association of Group A ependymomas with younger age at diagnosis, and Group B ependymomas with older age at diagnosis. Median age is also indicated. p-values were determined by a Mann-Whitney U test. (D–G) Pie charts demonstrating an association of Heidelberg Group A ependymomas with lateral localization, cerebellar invasion, increased recurrence, and death within 5 years from diagnosis compared with Group B tumors. Statistical significance of PF location and incidences of recurrence and death were determined by Fisher's exact test. (H) Kaplan-Meier survival curves demonstrating a worse progression-free and overall survival in Group A versus Group B ependymomas. Statistical significance was determined by a log-rank test. See also Table S1 and Figure S2.
Figure 3
Figure 3. Identification of Subgroup-Specific Copy Number Alterations in the Posterior Fossa Ependymoma Genome
(A) Copy number profiling of 75 PF ependymomas using 10K array-CGH identifies disparate genetic landscapes between Group A and Group B tumors. Toronto and Heidelberg copy number datasets have been combined and summarized in a heatmap. The heatmap also displays the association of tumors to cytogenetic risk groups 1, 2, and 3 (Korshunov et al., 2010). Statistically significant chromosomal aberrations (black boxes) are also displayed between both subgroups, calculated by Fisher's exact test. (B) Median averaged frequencies of DNA copy-number alterations of 45 Group A and 30 PF Group B tumors plotted against their chromosomal position. See also Figure S3.
Figure 4
Figure 4. Gene Set Enrichment Analysis Delineates Biological Pathways and Processes that Define Two Distinct Variants of Posterior Fossa Ependymoma
Gene Set Enrichment Analysis (GSEA) comparing Group A (red) against Group B (blue) PF ependymoma in the Toronto dataset, illustrating distinct pathways and biological processes between both subgroups (3.5% FDR, p = 0.01). Cytoscape and Enrichment Map were used for visualization of the GSEA results. Nodes represent enriched gene sets, which are grouped and annotated by their similarity according to related gene sets. Enrichment results were mapped as a network of gene sets (nodes). Node size is proportional to the total number of genes within each gene set. Proportion of shared genes between gene sets is represented as the thickness of the green line between nodes. This network map was manually curated removing general and uninformative sub-networks, resulting in a simplified network map shown in Figure 4. Fully detailed Toronto and Heidelberg network maps are illustrated in Figure S4, and GSEA results can be found in Table S2.
Figure 5
Figure 5. Selection and Optimization of PF Ependymoma Group A- and Group B-Specific IHC Markers
(A) Subgroup-specific expression patterns of selected markers, LAMA2 and NELL2, illustrated by heatmaps in both datasets. Candidate genes were identified using the Goeman's global test, which assigns a score to each gene based upon its degree of discrimination between defined classes: Group A and Group B. (B) Box plots derived from mRNA expression data displaying overall differences between markers representing Group A (LAMA2) and Group B (NELL2) in the Toronto and Heidelberg cohorts. Comparisons were performed using an unpaired t-test. (C) Representative immunohistochemistry (IHC) staining of LAMA2 and NELL2 on an ependymoma tissue microarray (TMA) composed of 265 PF ependymomas. (D) Pie chart illustrating the distribution of TMA staining for NELL2 and LAMA2. Eight-four percent of posterior fossa ependymomas stain positive for a single marker. See also Table S3 and Figure S5.
Figure 6
Figure 6. Clinical and Cytogenetic Characteristics Distinguishing IHC-Defined Group A and B Subgroups in a Third Nonoverlapping Posterior Fossa Ependymoma Cohort
(A) Comparing subgroup-specific cytogenetic aberrations and risk group classifications (Korshunov et al., 2010) between NELL2–/LAMA2+ and NELL2+/LAMA2– tumors of the TMA validation cohort. The heatmap illustrates the association of cytogenetic risk groups 2 and 3 with NELL2–/LAMA2+ tumors, and cytogenetic risk group 1 aberrations with NELL2+/LAMA2– tumors. Statistical significance was performed by Fisher's exact test (n = 155). NELL2+/LAMA2– tumors show a greater extent of genomic instability as expected from the increased genomic instability seen in Group B tumors in the discovery datasets. Conversely, NELL2–/LAMA2+ tumors exhibit a more balanced genomic profile, with chromosome 1q gain identified as the only significant chromosomal aberration. (B-G) Comparing subgroup-specific demographic and clinical information in the validation cohort illustrated by: (B) Box plots for age indicating that NELL2-/LAMA2+ tumors represent a significantly younger population than NELL2+/LAMA2— tumors; (C and D) Bar graphs demonstrating that NELL2-/LAMA2+ tumors are over-represented by males and WHO Grade III tumors; (E-G) Kaplan-Meier plots demonstrate that NELL2-/LAMA2+ tumors have an earlier time to metastasis and have a poorer progression-free and overall survival than NELL2+/LAMA2- tumors. Statistical significance of age was determined by a Mann-Whitney U test, gender and grade by a Fisher's exact test, and time to metastasis and survival by a log-rank test. (H and I) Limiting to gross-totally resected cases, Kaplan-Meier curves demonstrating that NELL2-/LAMA2+ tumors have a significantly poorer survival than NELL2+/LAMA2- tumors. Statistical significance was determined by a log-rank test. See also Table S4 and Figure S6.

Comment in

References

    1. Birkbak NJ, Eklund AC, Li Q, McClelland SE, Endesfelder D, Tan P, Tan IB, Richardson AL, Szallasi Z, Swanton C. Paradoxical relationship between chromosomal instability and survival outcome in cancer. Cancer Res. 2011;71:3447–3452. - PMC - PubMed
    1. Bouffet E, Perilongo G, Canete A, Massimino M. Intracranial ependymomas in children: a critical review of prognostic factors and a plea for cooperation. Med Pediatr Oncol. 1998;30:319–329. discussion 329–331. - PubMed
    1. Brunet JP, Tamayo P, Golub TR, Mesirov JP. Metagenes and molecular pattern discovery using matrix factorization. Proc Natl Acad Sci USA. 2004;101:4164–4169. - PMC - PubMed
    1. Carter M, Nicholson J, Ross F, Crolla J, Allibone R, Balaji V, Perry R, Walker D, Gilbertson R, Ellison DW. Genetic abnormalities detected in ependymomas by comparative genomic hybridisation. Br J Cancer. 2002;86:929–939. - PMC - PubMed
    1. Dyer S, Prebble E, Davison V, Davies P, Ramani P, Ellison D, Grundy R. Genomic imbalances in pediatric intracranial ependymomas define clinically relevant groups. Am J Pathol. 2002;161:2133–2141. - PMC - PubMed

Publication types