Review
. 2012 Mar;50(4):435-46.
doi: 10.1016/j.neuropsychologia.2011.07.013. Epub 2011 Jul 23.

Computational advances towards linking BOLD and behavior

Affiliations
Review

Computational advances towards linking BOLD and behavior

John T Serences et al. Neuropsychologia. 2012 Mar.

Abstract

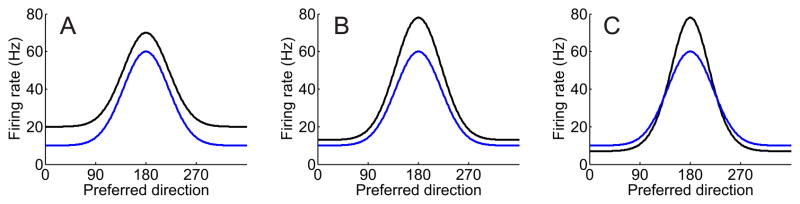
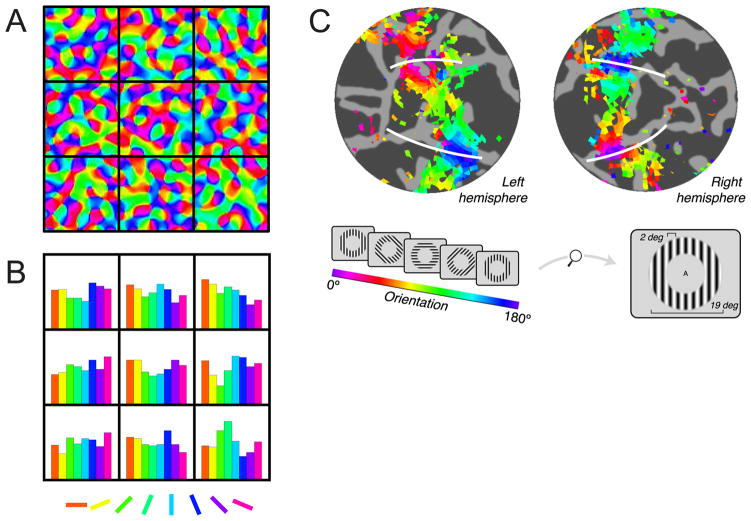
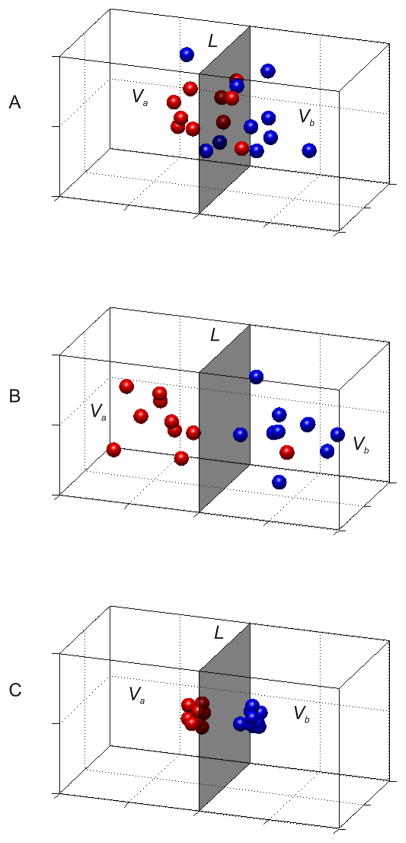
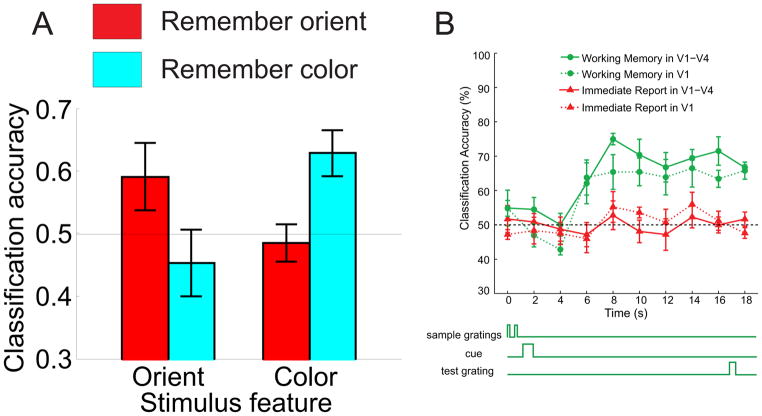
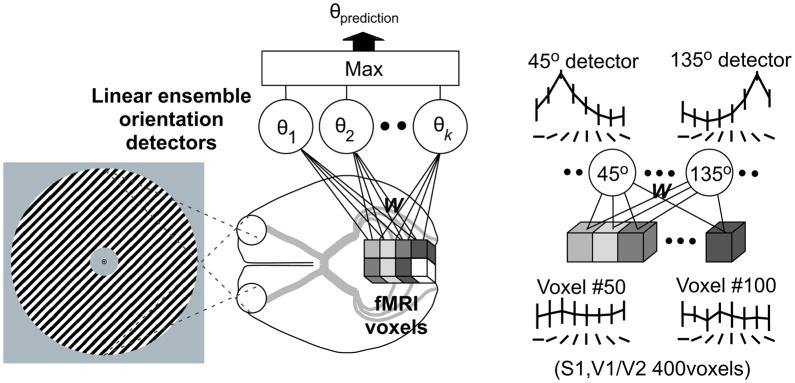
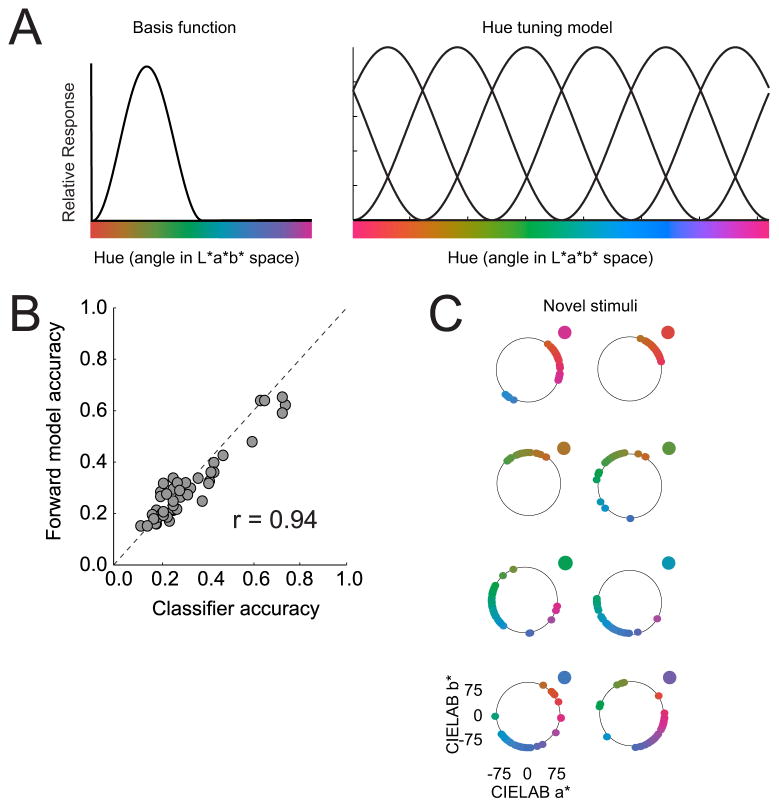
Traditionally, fMRI studies have focused on analyzing the mean response amplitude within a cortical area. However, the mean response is blind to many important patterns of cortical modulation, which severely limits the formulation and evaluation of linking hypotheses between neural activity, BOLD responses, and behavior. More recently, multivariate pattern classification analysis (MVPA) has been applied to fMRI data to evaluate the information content of spatially distributed activation patterns. This approach has been remarkably successful at detecting the presence of specific information in targeted brain regions, and provides an extremely flexible means of extracting that information without a precise generative model for the underlying neural activity. However, this flexibility comes at a cost: since MVPA relies on pooling information across voxels that are selective for many different stimulus attributes, it is difficult to infer how specific sub-sets of tuned neurons are modulated by an experimental manipulation. In contrast, recently developed encoding models can produce more precise estimates of feature-selective tuning functions, and can support the creation of explicit linking hypotheses between neural activity and behavior. Although these encoding models depend on strong - and often untested - assumptions about the response properties of underlying neural generators, they also provide a unique opportunity to evaluate population-level computational theories of perception and cognition that have previously been difficult to assess using either single-unit recording or conventional neuroimaging techniques.


Figures

Figure 1
Figure 1
Three different models of attentional modulation across a population of motion selective neurons tuned to different directions in middle temporal cortex (MT). The population response profile with attention is depicted in black, and the response profile without attention in blue. (a) model in which attention increases the response of all neurons in the population by a constant additive factor, (b) model in which attention modulates the firing rate of all neurons by a constant multiplicative gain factor, (c) model in which attention narrows the bandwidth of the population response profile by increasing the gain of neurons tuned to the attended feature, and suppressing the response of neurons tuned away from the attended feature.
Figure 2
Figure 2
(a) Synthetic orientation tuning map in primary visual cortex generated by band-pass filtering random orientation values. The black squares represent superimposed 3 × 3 mm fMRI voxels. (b) Histograms showing the distribution of orientation selectivity inside each voxel to each of the eight orientations. Aggregating the signal across many such biased voxels could potentially support orientation decoding (Panels a,b adapted with permission from G. Boynton, 2005, his Figure 1). (c) White lines depict the ventral and dorsal boundaries of human V1 (projected onto a computationally flattened cortical sheet), and each color represents areas that respond most strongly to a particular orientation (inset). The systematic orientation map across V1 – along with additional analyses – indicates that decoding might be supported by large scale feature-maps (panel c adapted with permission from J. Freeman et al., 2011, their Figure 1).
Figure 3
Figure 3
(a) Each point in the 3-dimensional space represents a response vector across three hypothetical voxels in response to either stimulus A (Va, in red), or stimulus B (Vb, in blue). The grey shaded region represents a classifier plane (L) that was computed based on data from an independent training set. (b) Same as (a), but the mean distance between the cluster centers has been increased, which in turn should improve the probability of successful classification. (c) Same as in (a,b) except the variance of each cluster is smaller, which will also increase the probability of successful classification.
Figure 4
Figure 4
(a) Subjects were instructed to remember either the orientation or the color of a sample stimulus, and then to retain only this relevant information across a 10s delay period. Bar-graph depicts classification accuracy (using the mean response across the delay period as input to the classifier) as a function of the stimulus feature (color or orientation) being classified and whether the subject was instructed to remember orientation or color during the scan used as the basis for classification. The horizontal lines highlight the level of chance performance. Classification accuracy was only significantly higher than chance for the relevant feature that the subject was instructed to remember. (b) Timecourse (see schematic) of classification accuracy in a study where subjects either had to remember the orientation of a stimulus across a delay period, or they had to perform an immediate report control task (i.e. a task with no WM requirements). These data show significant memory related classification in both V1 and across other early visual areas V1-V4 when the data were combined. Panel (a) used with permission from Serences et al. (2009), their Figure 3a, and panel (b) used with permission from F. Tong, adapted from Harrison and Tong (2009), their Figure S5.
Figure 5
Figure 5
(a) Each cube depicts an input fMRI activity pattern in a voxel measured while a subject viewed gratings of a given orientation. The circles represent ‘linear ensemble orientation detectors’, each of which combines the weights (W) for each voxel such that the output of each detector becomes largest for its ‘preferred orientation’ (Ti). The classifier then guesses that the subject was viewing the preferred orientation of the detector with the highest value. (b) The output from two orientation detectors (tuned to 45° and 135°, respectively) showing highly selective response profiles that are the result of the optimal pooling of information across many weakly selective voxels. Figure used with permission from F. Tong, and reprinted from Figure 1 of Kamitani and Tong (2005).
Figure 6
Figure 6
(a) Graphic depiction of forward encoding model used by Brouwer and Heeger (2009). The response of each voxel is modeled as the sum of weighted responses across six hypothetical color channels, where each color channel is modeled as a half-wave rectified and squared sinusoidal function. See text for more details. Panel (a) reprinted with permission from Brouwer and Heeger (2009). (b) The decoding accuracy using forward model channel responses was virtually equivalent to that obtained using a standard MVPA classifier. (c) Most importantly, however, the encoding model presented in (a) could even reconstruct color stimuli that were not part of the training set. Each point of color on the circle represents a reconstructed color for one run where the novel color was the color dot outside the circle.

References

    1. Andersen RA, Hwang EJ, Mulliken GH. Cognitive neural prosthetics. Annual review of psychology. 2010;61:169–190. C161–163. - PMC - PubMed
    1. Awh E, Jonides J. Overlapping mechanisms of attention and spatial working memory. Trends in cognitive sciences. 2001;5:119–126. - PubMed
    1. Boynton GM. Attention and visual perception. Current opinion in neurobiology. 2005a;15:465–469. - PubMed
    1. Boynton GM. Imaging orientation selectivity: decoding conscious perception in V1. Nature neuroscience. 2005b;8:541–542. - PubMed
    1. Boynton GM, Demb JB, Glover GH, Heeger DJ. Neuronal basis of contrast discrimination. Vision research. 1999;39:257–269. - PubMed

Publication types