Comparative Study
. 2011 Aug 14;17(9):1067-75.
doi: 10.1038/nm.2414.

Pathway to diabetes through attenuation of pancreatic beta cell glycosylation and glucose transport

Affiliations
Comparative Study

Pathway to diabetes through attenuation of pancreatic beta cell glycosylation and glucose transport

Kazuaki Ohtsubo et al. Nat Med. .

Abstract

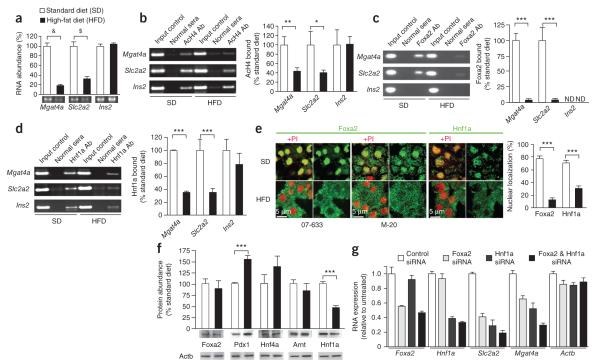
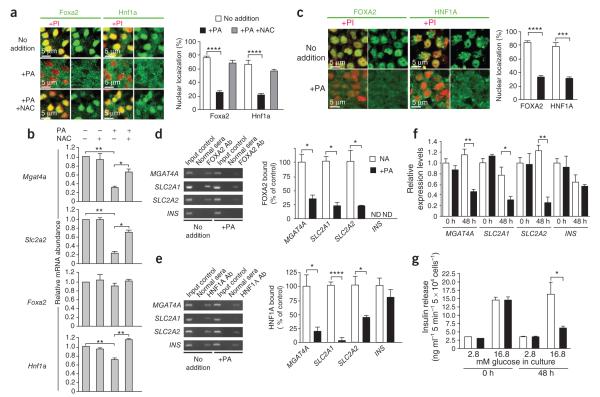
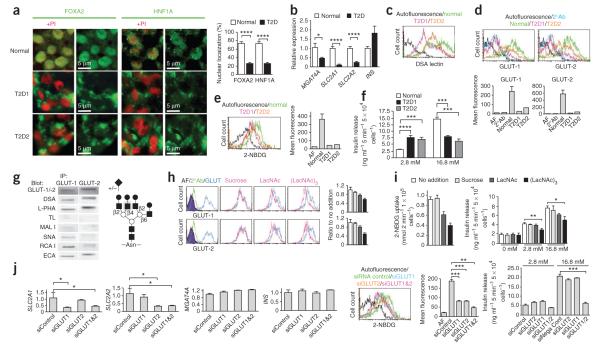
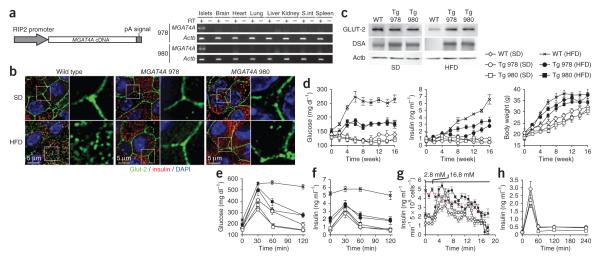
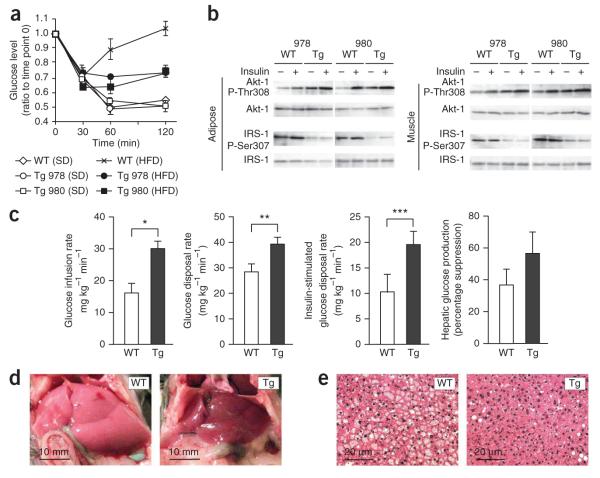
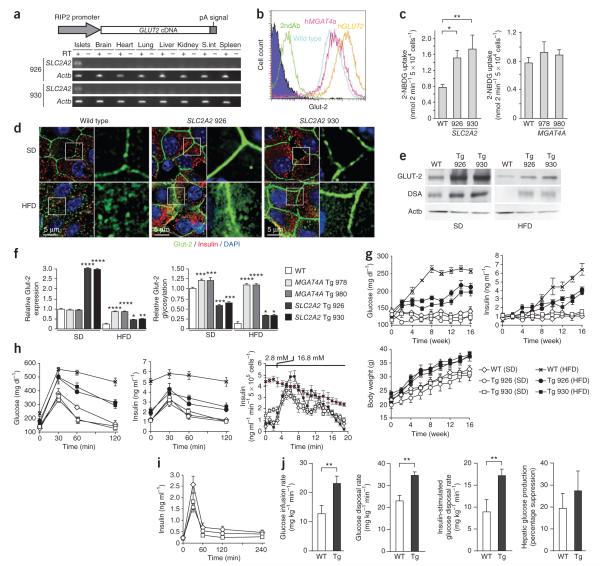
A connection between diet, obesity and diabetes exists in multiple species and is the basis of an escalating human health problem. The factors responsible provoke both insulin resistance and pancreatic beta cell dysfunction but remain to be fully identified. We report a combination of molecular events in human and mouse pancreatic beta cells, induced by elevated levels of free fatty acids or by administration of a high-fat diet with associated obesity, that comprise a pathogenic pathway to diabetes. Elevated concentrations of free fatty acids caused nuclear exclusion and reduced expression of the transcription factors FOXA2 and HNF1A in beta cells. This resulted in a deficit of GnT-4a glycosyltransferase expression in beta cells that produced signs of metabolic disease, including hyperglycemia, impaired glucose tolerance, hyperinsulinemia, hepatic steatosis and diminished insulin action in muscle and adipose tissues. Protection from disease was conferred by enforced beta cell-specific GnT-4a protein glycosylation and involved the maintenance of glucose transporter expression and the preservation of glucose transport. We observed that this pathogenic process was active in human islet cells obtained from donors with type 2 diabetes; thus, illuminating a pathway to disease implicated in the diet- and obesity-associated component of type 2 diabetes mellitus.


Figures

Figure 1
Figure 1
Dietary regulation of Mgat4a and Slc2a2 gene expression by Foxa2 and Hnf1a in mouse pancreatic islet cells. (a) Abundance of mRNA produced from Mgat4a, Slc2a2 and Ins2 genes in mouse pancreatic islet cells (>90% beta cells) isolated from 18- to 22-week-old WT mice on standard (SD) and high-fat diet (HFD) dietary regimens. (b–d) ChIP and real-time PCR (rtPCR) analysis of acetylated histone H4 (AcH4) bound to promoter regions of the Mgat4a, Slc2a2 and Ins2 genes (b) and binding to these regions by Foxa2 (c) and Hnf1a (d). ND, not detected. (e) In situ localization of Foxa2 and Hnf1a proteins in beta cells from mouse islet tissue in response to diet. Results represent analyses of >24 fields of view consisting of >100 beta cells. Two different antibodies that detect Foxa2 (07-633 and M-20) were used. Image analyses quantified percentage of cellular protein localized to nuclear region. (f) Total islet cell abundance of Foxa2, Pdx1, Hnf4a, Arnt and Hnf1a proteins determined using antibodies specific for each factor. (g) Pancreatic beta cells from mice receiving SD transfected with siRNAs to knock down Foxa2 and Hnf1a, or with a siRNA control, were cultured for 72 h followed by mRNA abundance measurements using rtPCR. Mice for study were normal C57BL/6J mice 18–22 weeks old before initial experimentation. Data in a–f are means ± s.e.m. of triplicate experiments per mouse from ≥12 mice consisting of ≥6 separate littermate pairs. &P = 0.0007; $P = 0.0049; *P = 0.0421; **P = 0.0418; ***P < 0.0001 (Student’s t test, a–f; Bonferroni test after analysis of variance (ANOVA), g).rtPCR measurement of FOXA2 (d) and HNF1A (e) proteins bound to promoter regions of human MGAT4A, SLC2A1, SLC2A2 and INS detected; NA, no addition. (f) Abundance of mRNA from MGAT4A, SLC2A1, SLC2A2 and genes in human islet cells. (g secretion assayed in islet cell cultures containing medium bearing indicated concentrations of glucose. Results in a and c fields of view consisting of >100 beta cells. Data are means ± s.e.m. of triplicate experiments per mouse from six mice fed standard diet and four normal human islet donors. *P = 0.01–0.049; **P = 0.005–0.009; ***P = 0.0004; ****P < 0.0001 (Student’s t test).
Figure 2
Figure 2
Effect of palmitic acid on normal mouse and human islet cells. (a) Subcellular localization of Foxa2 and Hnf1a proteins within beta cells from islet tissue measured in response to palmitic acid (PA) and N-acetylcysteine (NAC). Propidium iodide (PI) staining of the nucleus (red) is also included where indicated. (b) mRNA expression of Mgat4a, Slc2a2, Foxa2 and Hnf1a measured by rtPCR from WT islet cells isolated and cultured in medium containing 5 mM glucose for 48 h with or without PA and NAC. Islets in a and b were isolated from normal C57BL/6J mice maintained on standard diet. (c) In situ localization of FOXA2 and HNF1A proteins in beta cells from normal human islet tissue measured with or without PA. (d,e) ChIP and rtPCR measurement of FOXA2 (d) and HNF1A (e) proteins bound to promoter regions of human MGAT4A, SLC2A1, SLC2A2 and INS genes. ND, not detected; NA, no addition. (f) Abundance of mRNA from MGAT4A, SLC2A1, SLC2A2 and genes in human islet cells. (g) Glucose-stimulated insulin secretion assayed in islet cell cultures containing medium bearing indicated concentrations of glucose. Results in a and c represent analyses of >24 fields of view consisting of >100 beta cells. Data are means ± s.e.m. of triplicate experiments per mouse from six mice fed standard diet and four normal human islet donors. *P = 0.01–0.049; **P = 0.005–0.009; ***P = 0.0004; ****P < 0.0001 (Student’s t test).
Figure 3
Figure 3
Analyses of human islets from normal donors and donors with type 2 diabetes. (a) Subcellular localization of FOXA2 and HNF1A proteins in human beta cells from normal donors and donors with type 2 diabetes (T2D). Results represent analyses of six normal islet samples and two T2D islet samples. Propidium iodide (PI) staining of the nucleus (red) is included where indicated. (b) Abundance of mRNA produced from MGAT4A, SLC2A1, SLC2A2 and INS genes in the designated human islet cells. (c) Islet cell surface abundance of the DSA lectin-binding glycan produced by the GnT-4a glycosyltransferase. (d) Islet cell surface expression of human GLUT-1 and GLUT-2 glucose transporters. (e) Glucose transport activity of the indicated human islets measured using the fluorescent glucose analog 2-NBDG. (f) Glucose-stimulated insulin secretion assayed in islet cell cultures containing medium bearing the indicated concentrations of glucose. (g) Left, GLUT-1 and GLUT-2 glycoproteins were immunoprecipitated (IP) from normal human islet cell extracts followed by electrophoresis and analyses with the indicated antibodies and lectins. Right, deduced tetra-antennary N-glycan structure residing on both human islet cell GLUT-1 and GLUT-2 bearing undersialylated glycan branch termini (+/−). Gray circle, core β1-4GlcNAc linkage produced by GnT-4a. (h) Normal human islet cells were cultured with or without the indicated glycans (10 mM) for 2 h before analyses of cell surface GLUT-1 and GLUT-2 expression by flow cytometry. (i) Fluorescent glucose analog (2-NBDG) transport (left) and GSIS activity (right) measured among islet cells treated in h. The results in h and i represent analyses of three islet cell samples from normal human donors. (j) siRNA knockdown of GLUT1 and GLUT2 mRNA in normal human islet cell cultures measured at 72 h (left four graphs). Glucose analog 2-NBDG transport and GSIS activity were also measured at 72 h. Data are expressed as means ± s.e.m. from six normal human islet donors and two human donors with T2D, unless otherwise stated. *P = 0.01–0.04; **P = 0.002–0.005; ***P = 0.0002–0.0005; ****P < 0.0001 (Student’s t test).
Figure 4
Figure 4
Enforced beta cell–specific GnT-4a glycosylation prevents loss of Glut-2 expression and inhibits onset of disease signs including hyperglycemia and failure of GSIS. (a) Human MGAT4A cDNA was incorporated into a transgene vector that conferred beta cell–specific expression in multiple tissues of two separate founder lines, 978 and 980. Transgene expression was detected using vector-specific primers. (b) Pancreatic beta cell histology from WT and MGAT4A transgenic littermates that received either standard diet (SD) or high-fat diet (HFD) for the preceding 10 weeks. Antibody binding and visualization of GLUT-2 (green), insulin (red) and DNA (DAPI-blue). (c) GLUT-2 protein abundance and glycosylation in beta cells from WT or MGAT4A (Tg) littermates as in b were analyzed by blotting GLUT-2 immunoprecipitates with antibody to GLUT-2 or DSA lectin. Single analysis shown represents three independent experiments with different littermates. (d) Blood glucose (left), blood insulin (center) and body weight (right) were measured (unfasted) every 2 weeks for up to 16 weeks of HFD administration (e,f). In fasted mice receiving SD or the HFD for 10 weeks, glucose was injected into the intraperitoneal space before analysis of glucose tolerance (e) and insulin release (f). (g) GSIS activity was analyzed ex vivo by perifusion in islet cells isolated from mice that received either SD or HFD for the preceding 4 weeks. Glucose concentration was increased from 2.8 mM to 16.8 mM at the time indicated. Data are mean ± s.e.m. of three independent studies of beta cells from distinct littermates. Data from WT beta cells, red line. (h) Insulin secretion response to l-arginine injection measured in fasting WT and MGAT4A Tg mice receiving SD. Data are means ± s.e.m. in triplicate experiments per mouse, from six or seven mice of each genotype unless otherwise stated.
Figure 5
Figure 5
Beta cell–specific GnT-4a protein glycosylation promotes systemic insulin sensitivity and inhibits development of hepatic steatosis. (a) Insulin challenge response measured in 16–18 week old littermates of indicated genotypes after 10 weeks of standard diet (SD) or high-fat diet (HFD) administration. (b) Phosphorylation of Akt-1 at Thr308 a nd IRS-1 at Ser307 in equivalent cellular protein preparations from adipose and muscle tissue of mice as in a after 2 min of insulin perfusion through inferior vena cava. (c) Euglycemic and hyperinsulinemic clamp studies after 10 weeks on HFD compared measurements of glucose infusion rate, glucose disposal rate, insulin-stimulated glucose disposal rate, and suppression of hepatic glucose production in response to insulin. The analyses included nine WT and seven Tg mice. (d,e) Liver tissue observed macroscopically (d) and by histological analysis stained with H&E (e). *P = 0.0017; **P = 0.0235; ***P = 0.0401 (single-tail t test). Data are means ± s.e.m. from three or more littermates unless otherwise indicated.
Figure 6
Figure 6
Enforced beta cell–specific expression of GnT-4a substrate GLUT-2 mitigates diet- and obesity-induced diabetes. (a) Human SLC2A2 cDNA was incorporated into a transgene vector that conferred beta cell–specific expression in multiple tissues of two separate founder lines, 926 and 930. (b) Beta cell surface expression of GLUT-2 analyzed by flow cytometry from WT, MGAT4A Tg (978), and SLC2A2 Tg (926) mice receiving standard diet (SD). (c) Glucose analog 2-NBDG transport into cultured islet cells isolated from WT mice and Tg littermates fed SD. (d) Pancreatic beta cell histology of WT and MGAT4A Tg littermates that received either SD or high-fat diet (HFD) for the preceding 10 weeks. Antibody binding and visualization of Glut-2 (green), insulin (red) and DNA (blue). (e) Islet cell Glut-2 and GLUT-2 immunoprecipitates were analyzed for Glut-2 abundance and DSA lectin binding from WT or SLC2A2 Tg littermates administered indicated dietary stimuli. Single analysis shown represents three independent experiments with different littermates. (f) Histogram of GLUT-2 protein abundance (left) and GLUT-2 glycosylation (right) was calculated from results in e. (g) Blood glucose (left), blood insulin (right) and body weight (bottom) were measured in unfasted mice every 2 weeks for up to 16 weeks of indicated diet administration. (h) In fasted mice that had received SD or HFD for 10 weeks, glucose tolerance tests measured blood glucose (left) and insulin release (middle). GSIS activity was analyzed ex vivo by perifusion (bottom) in islet cells isolated from mice that received either SD or HFD for preceding 4 weeks. Glucose concentration was increased from 2.8 mM to 16.8 mM at time indicated. Data from WT beta cells, red line. (i) Insulin secretion response to l-arginine injection in fasting WT and SLC2A2 Tg mice receiving SD. (j) Euglycemic and hyperinsulinemic clamp studies after 10 weeks on HFD compared measurements of glucose infusion rate, glucose disposal rate, insulin-stimulated glucose disposal rate and hepatic suppression of gluconeogenesis. The clamp studies included eight WT and eight SLC2A2 Tg littermates. Data plotted throughout are means ± s.e.m. At least six or seven mice including littermates were studied in each experiment unless otherwise stated. *P = 0.01–0.04; **P = 0.001–0.09; ***P = 0.0001–0.0009; ****P < 0.0001 (Student’s t test, c, f and g; single-tail t test, j).

Comment in

References

    1. Olefsky JM, Courtney CH. Type 2 diabetes mellitus: etiology, pathogenesis and natural history. In: DeGroot LJ, et al., editors. Endocrinology. 5th edn W.B. Saunders; 2005. pp. 1093–1117.
    1. Weir GC, Leahy JL. Pathogenesis of non-insulin dependent (type II) diabetes mellitus. In: Joslin EP, Kahn CR, Weir GC, editors. Joslin’s Diabetes Mellitus. Lea and Febiger; 1994. pp. 240–264. Ch. 14.
    1. Smyth S, Heron A. Diabetes and obesity: the twin epidemics. Nat. Med. 2006;12:75–80. - PubMed
    1. Korner J, Woods SC, Woodworth KA. Regulation of energy homeostasis and heath consequences in obesity. Am. J. Med. 2009;122:S12–S18. - PubMed
    1. Parillo M, Ricardi G. Diet composition and the risk of type 2 diabetes: epidemiological and clinical evidence. Br. J. Nutr. 2004;92:7–19. - PubMed

Publication types

MeSH terms