. 2011 Aug 14;12(9):898-907.
doi: 10.1038/ni.2084.

Repression of the genome organizer SATB1 in regulatory T cells is required for suppressive function and inhibition of effector differentiation

Affiliations

Repression of the genome organizer SATB1 in regulatory T cells is required for suppressive function and inhibition of effector differentiation

Marc Beyer et al. Nat Immunol. .

Abstract

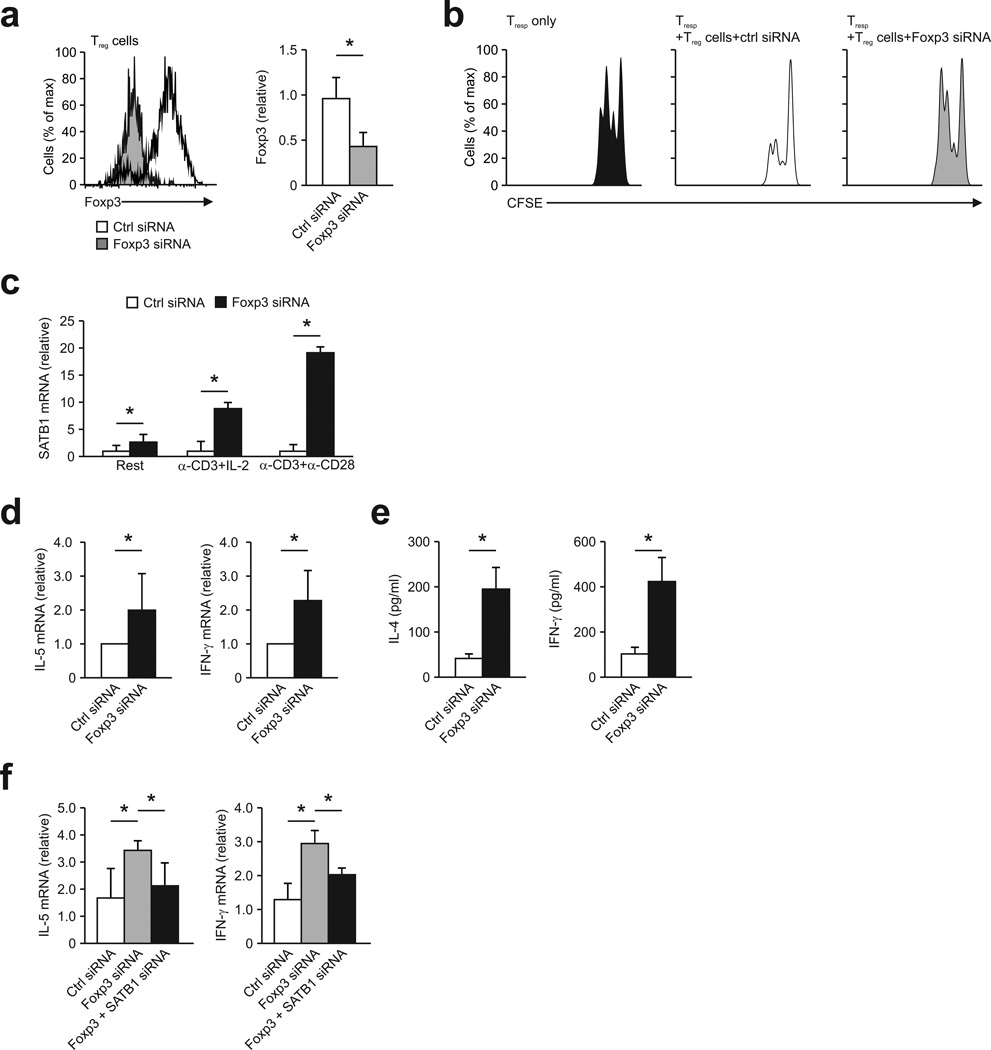
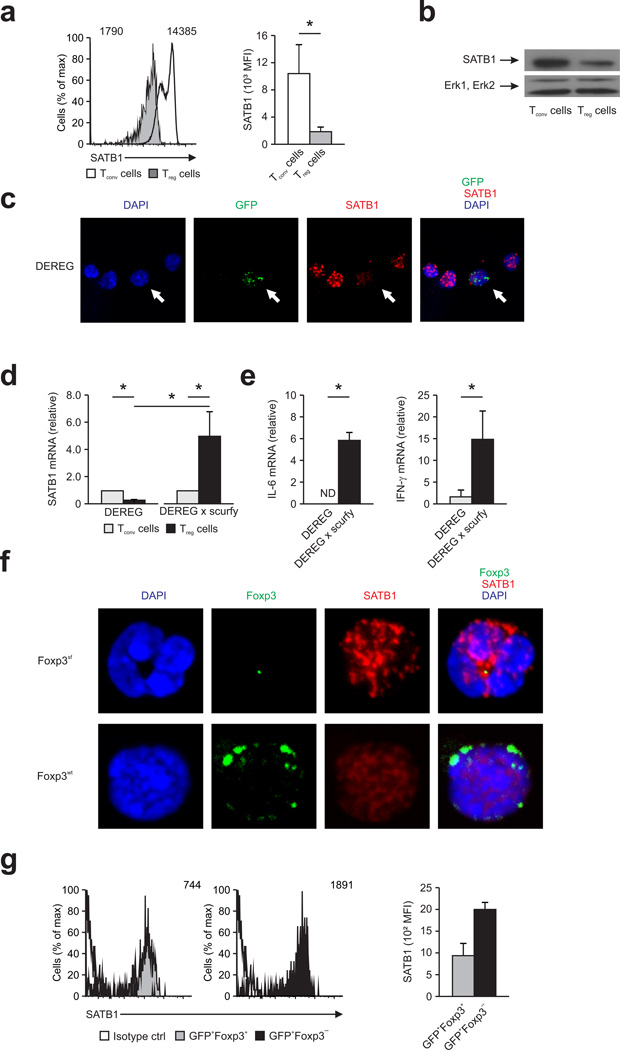
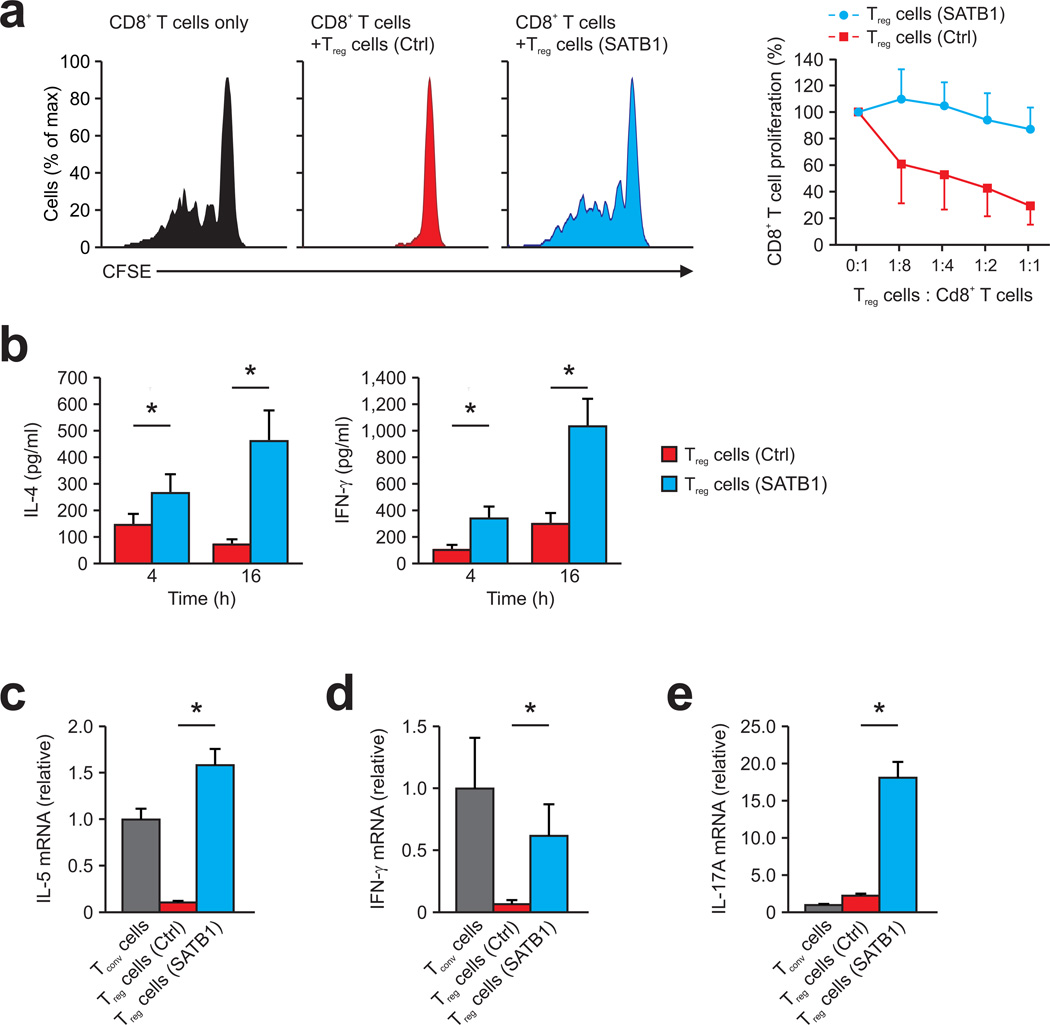
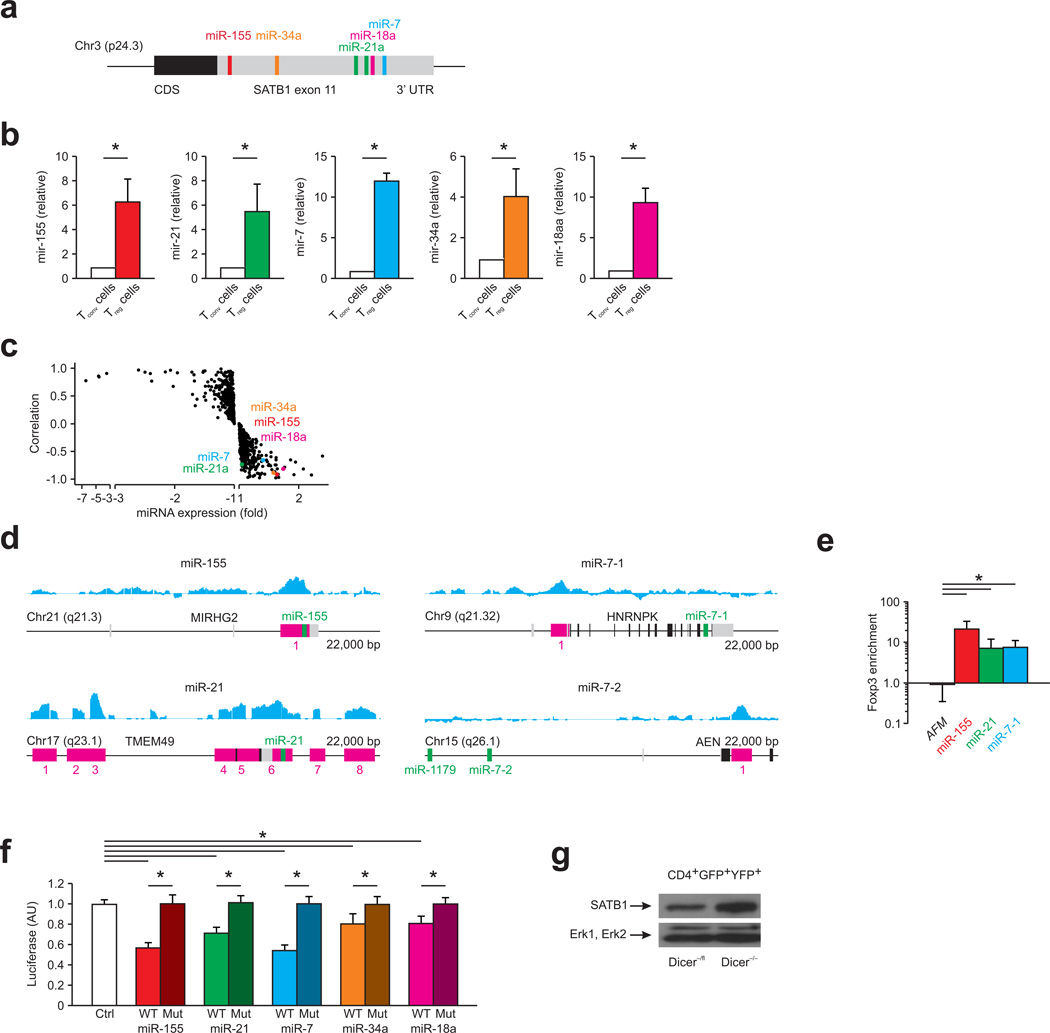
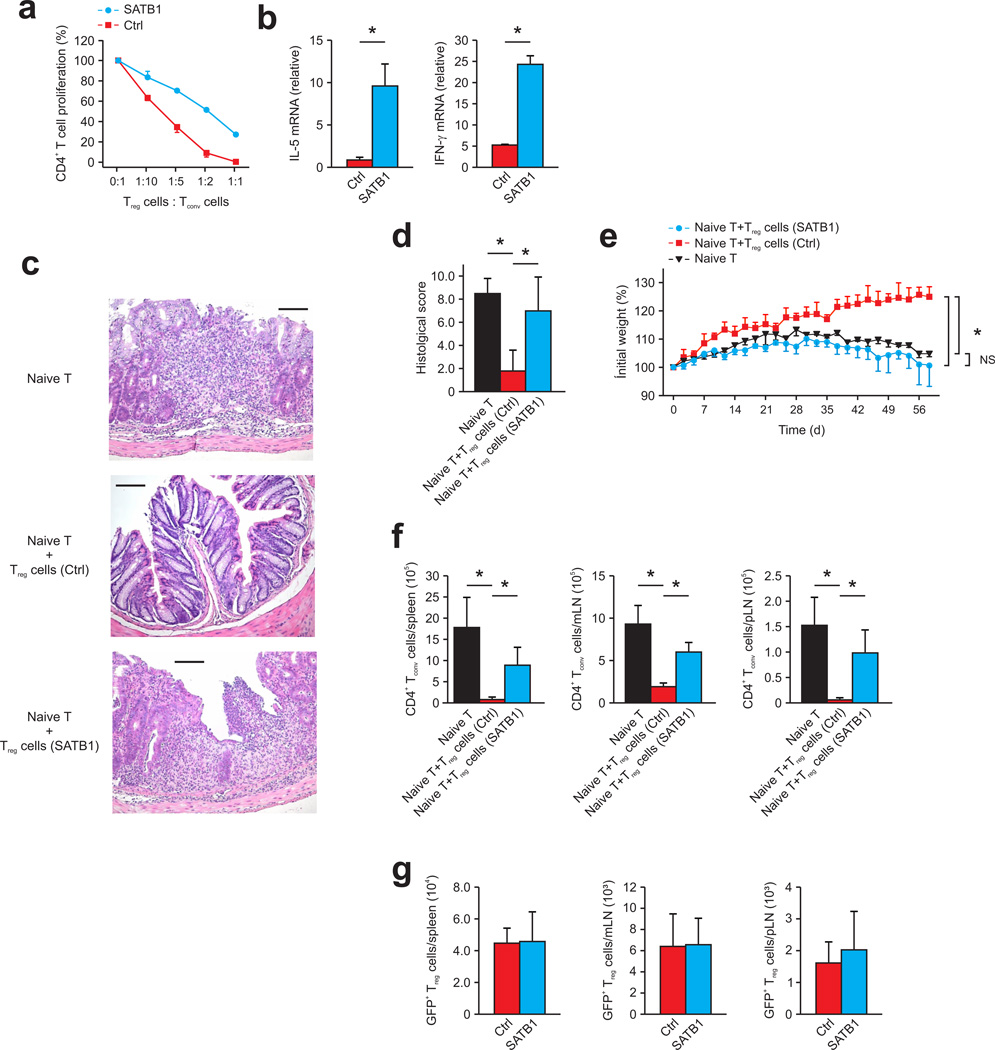
Regulatory T cells (T(reg) cells) are essential for self-tolerance and immune homeostasis. Lack of effector T cell (T(eff) cell) function and gain of suppressive activity by T(reg) cells are dependent on the transcriptional program induced by Foxp3. Here we report that repression of SATB1, a genome organizer that regulates chromatin structure and gene expression, was crucial for the phenotype and function of T(reg) cells. Foxp3, acting as a transcriptional repressor, directly suppressed the SATB1 locus and indirectly suppressed it through the induction of microRNAs that bound the SATB1 3' untranslated region. Release of SATB1 from the control of Foxp3 in T(reg) cells caused loss of suppressive function, establishment of transcriptional T(eff) cell programs and induction of T(eff) cell cytokines. Our data support the proposal that inhibition of SATB1-mediated modulation of global chromatin remodeling is pivotal for maintaining T(reg) cell functionality.


Figures

Figure 1
Figure 1. Foxp3-dependent repression of SATB1 expression in human Treg cells
(a) Microarray analysis of SATB1 mRNA expression in human Tconv and Treg (Rest=resting, Act=activated, TGF=TGF-β treated, Exp=expanded). (b) Relative SATB1 mRNA expression in human Treg and Tconv. (c) Immunoblotting (left) for SATB1 (top) and β-actin (bottom) in human Treg and Tconv, and densitometric analysis to quantify ratio of SATB1 to β-actin (right). (d) SATB1 expression was determined by flow cytometry (left) in human Treg and Tconv with quantification shown in the graph at right. (e) SATB1 expression was determined by flow cytometry after stimulation of human Treg and Tconv for 2 d (left) with quantification shown normalized to resting Tconv in the graph at right. (f) Relative SATB1 mRNA expression in human iTreg, stimulated T cells (stim T) and unstimulated T cells (unstim T) on day 5. (g) SATB1 expression was determined by flow cytometry in human iTreg, stim T and unstim T (left) with quantification shown in the graph at right. (h) Cytometric bead assay for IL-4 and IFN-γ secretion in the supernatants of human iTreg, stim T and unstim T. (i) Relative Foxp3 (left) and SATB1 mRNA expression (right) in Tconv lentivirally transduced with Foxp3 vector (Foxp3 vector) or control vector (Ctrl vector) rested for 3 days. (j) Relative IL-5 (left) and IFN-γ mRNA expression (right), assessed and presented as in i. *P < 0.05 (Student’s t-test). Numbers in plots indicate mean fluorescence intensity (d,e). Data are representative of five experiments (b,e,i,j; mean and s.d.), six experiments (c,f; mean and s.d.), three experiments (g; mean and s.d.), eleven experiments (d; mean and s.d.), or three independent experiments (h; mean ± s.d. of triplicate wells), each with cells derived from a different donor.
Figure 2
Figure 2. Rescue of SATB1 expression after silencing of Foxp3 in Treg cells
(a) Foxp3 expression was determined by flow cytometry (left) in human Treg transfected with siRNA targeting Foxp3 (Foxp3 siRNA) or nontargeting (control) siRNA (Ctrl siRNA) 48 h post knockdown with quantification shown in the graph at right. *P < 0.05 (Student’s t-test). (b) Suppression of allogeneic CD4+ T cells, labeled with the cytosolic dye CFSE (responding T cells (Tresp)) by human Treg transfected with siRNA targeting Foxp3 (Foxp3 siRNA) or nontargeting (control) siRNA (Ctrl siRNA), presented as CFSE dilution in responding T cells cultured with CD3+CD28-coated beads and Treg at a ratio of 1:1 or without Treg (Tresp only). (c) Relative SATB1 mRNA expression in human Treg after silencing of Foxp3. Treg were transfected and cultivated for 48 hours without stimulation (Rest) or in the presence of CD3 and IL-2 (α-CD3+IL-2) or CD3 and CD28 (α-CD3+α-CD-28). *P < 0.05 (Student’s t-test). (d) Relative IL-5 (left) and IFN-γ mRNA expression (right) in siRNA-treated Treg stimulated for 48 hours in the presence CD3 and IL-2. *P < 0.05 (Student’s t-test). (e) Cytometric bead assay for IL-4 and IFN-γ secretion in the supernatants of siRNA-treated Treg stimulated as in d. *P < 0.05 (Student’s t-test). (f) Relative IL-5 (left) and IFN-γ mRNA expression (right) in Treg transfected with nontargeting (control) siRNA (Ctrl siRNA), Foxp3-targeting siRNA (Foxp3 siRNA) or Foxp3- and SATB1-targeting siRNA (Foxp3 + SATB1 siRNA) followed by stimulation with CD3+CD28-coated beads for 48 hours. *P < 0.05 (one-way ANOVA with LSD). Data are representative of six experiments (a,c; mean and s.d.), four experiments (d,f; mean and s.d.), three independent experiments (b), or three independent experiments (e; mean ± s.d. of triplicate wells), each with cells derived from a different donor.
Figure 3
Figure 3. Foxp3-dependent repression of SATB1 expression in mouse Treg cells
(a) SATB1 expression was determined by flow cytometry (left) in freshly isolated Treg and Tconv from spleen of male DEREG mice with quantification shown in the graph at right. *P < 0.05 (Student’s t-test). (b) Immunoblotting for SATB1 (top) and Erk1, Erk2 (bottom) in mouse Treg and Tconv. (c) Z-projection of immunofluorescence for SATB1 (red) and GFP (green) in thymocytes from male DEREG mice; nuclei are stained with the DNA-intercalating dye DAPI. White arrow depicts Treg. (d) Relative SATB1 mRNA expression in CD4+GFP+ (Treg) and CD4+GFP (Tconv) T cells from male DEREG or Foxp3-deficient DEREG × scurfy mice. *P < 0.05 (Student’s t-test). (e) Relative IL-6 (left) and IFN-γ mRNA expression (right) in CD4+GFP+ Treg derived from male DEREG or Foxp3-deficient DEREG × scurfy mice. *P < 0.05 (Student’s t-test). (f) Confocal microscopy for SATB1 (red) and Foxp3 (green) in thymic Treg from female DEREG mice heterozygous for the scurfy mutation counterstained with DAPI (blue). CD4+GFP+FOXP3 Foxp3-deficient Treg (top, Foxp3sf) or CD4+GFP+FOXP3+ Foxp3-competent Treg (bottom, Foxp3wt). (g) SATB1 expression was determined by flow cytometry (left) in thymic single positive CD4+GFP+FOXP3+ (left, grey) and CD4+GFP+FOXP3 Treg (right, black) from female DEREG mice heterozygous for the scurfy mutation with quantification shown in the graph at right. Isotype control shown as solid line. Numbers in plots indicate mean fluorescence intensity (a,g). Data are representative of three independent experiments (a; mean and s.d.), two independent experiments (g; mean and s.d.), two independent experiments (c,f,b), or two independent experiments (d,e; mean ± s.d. of triplicate wells).
Figure 4
Figure 4. Direct suppression of SATB1 transcription by Foxp3
(a) Foxp3 ChIP tiling array data (blue) from human expanded cord-blood Treg. Data were analyzed with MAT and overlayed to the SATB1 locus to identify binding regions (1–13, p < 10−5 and FDR < 0.5%). Data are representative of two independent experiments with cells derived from different donors. (b) Schematic representation of Foxp3 binding regions (BR) at the human genomic SATB1 locus identified by in silico prediction within the regions identified in a. (c) ChIP analysis of human expanded cord-blood Treg cells with a Foxp3-specific antibody and PCR primers specific for Foxp3 binding regions. Relative enrichment of Foxp3 ChIP over input normalized to IgG was calculated. A region −15 kb upstream (−15kb) was used as a negative control. *P < 0.05 (Student’s t-test). Data are representative of three independent experiments (mean and s.d.) with cells derived from different donors. (d) Luciferase assay of FOXP3 binding to the respective binding regions at the SATB1 locus in HEK293T cells, transfected with luciferase constructs containing wild-type (WT) or mutated (Mut) binding regions BR9–14 of the SATB1 locus (with mutation of the Foxp3-binding motifs), together with a FOXP3 encoding expression vector or control vector (Ctrl). *P < 0.05 (Student’s t-test). Data is from one representative experiment of two (mean and s.d. of triplicate wells). Numbers indicate Foxp3-binding motifs within each region. (e) Determination of the KD-values of Foxp3 binding to a wild-type (WT) or mutated (Mut) Foxp3 binding motif in BR9 and BR10 at the SATB1 locus by filter retention analysis. Data are representative of three independent experiments (mean and s.d. of triplicates).
Figure 5
Figure 5. SATB1 expression in human Treg reprograms Treg into effector T cells
(a) Suppression of CD8+ T cells, labeled with the cytosolic dye CFSE (CD8+ T cells) by human Treg lentivirally transduced with SATB1 (Treg cells (SATB1), blue) or control vector (Treg cells (Ctrl), red), presented as CFSE dilution in responding T cells cultured with CD3-coated beads and Treg at a ratio of 1:1 or without Treg (CD8+ T cells only; left), and as percent proliferating CD8+ T cells versus the Treg cell/CD8+ T cell ratio (right). Data are representative of three independent experiments (mean and s.d.) with cells derived from different donors. (b) Cytometric bead assay for IL-4 and IFN-γ secretion in the supernatants of human Treg lentivirally transduced with SATB1 (Treg cells (SATB1), blue) or control vector (Treg cells (Ctrl), red) assessed 4 and 16 h after stimulation with CD3+CD28-coated beads. *P < 0.05 (Student’s t-test). Data is from one representative experiment of two (mean and s.d. of triplicate wells) with cells derived from different donors. (c–e) Relative IL-5 (c), IFN-γ (d), and IL-17A (e) mRNA expression (right) in human Tconv (grey) and Treg lentivirally transduced with SATB1 (Treg cells (SATB1), blue) or control vector (Treg cells (Ctrl), red) activated for 16 h with CD3+CD28-coated beads. *P < 0.05 (Student’s t-test). Data is from one representative experiment of two (mean and s.d. of triplicate wells) with cells derived from different donors.
Figure 6
Figure 6. Transcriptional Teff programs are induced in SATB1 expressing Treg
(a) Microarray analysis of human Treg lentivirally transduced with SATB1 (SATB1) or control vector (Ctrl) after 16 hours stimulation with CD3+CD28-coated beads, presented as a heat map of differentially expressed genes. Data were z-score normalized. (b) Cross annotation analysis using 4 classes: genes associated with Tconv but not Treg cells (Tconv cell-dependent, yellow), with T cell activation (activation-dependent, green), common T-cell genes (common, orange), and SATB1-induced genes (SATB1-induced, black). Numbers indicate genes within each group. (c) Visualization of gene expression levels of genes previously associated with TH1, TH2, or TH17 differentiation, presented as a heat map. Data were z-score normalized. P values for TH associated genes determined by χ2 test in comparison to the complete data set (TH specific gene enrichment): TH1, P = 3.24×10⁻⁶; TH2, P = 9.03×10⁻¹⁵; TH17, P = 1.16×10⁻⁶. (d) Changes in genes associated with the human Treg signature as assessed in Treg lentivirally transduced with SATB1 (SATB1) in comparison to control vector (Ctrl). The mean log2 fold-changes of the comparison Treg to Tconv (red dots) and SATB1 to control-transduced Treg (blue dots) were plotted and both comparisons were ranked by fold change in the Treg vs. Tconv comparison. Data are derived from three independent experiments with cells derived from different donors.
Figure 7
Figure 7. SATB1 expression is repressed by miRNA in Treg
(a) Representation of the human genomic SATB1 3′ UTR and the conserved miRNA binding sites. (b) Relative miR-155, miR-21, miR-7, miR-34a, and miR-18a expression human Treg and Tconv. *P < 0.05 (Student’s t-test). Data are representative of five experiments (mean and s.d.) with cells derived from different donors. (c) Correlation of miRNA expression with SATB1 mRNA expression is plotted against miRNA fold change (Treg vs. Tconv) for all 735 miRNA assessed by microarrays. Highlighted are miR-155, miR-21, miR-7, miR-34a, and miR-18a. Data are representative of three experiments with cells derived from different donors. (d) Foxp3 ChIP tiling array data (blue) for miR-155, miR-21, and miR-7 from human expanded cord-blood Treg. Data were analyzed with MAT and overlayed to the respective locus to identify binding regions (P < 10−5 and FDR < 0.5%). Data are representative of two independent experiments with cells derived from different donors. (e) ChIP analysis of human expanded cord-blood Treg cells with a Foxp3-specific antibody and PCR primers specific for miR-155, miR-21, and miR-7. Relative enrichment of Foxp3 ChIP over input normalized to IgG was calculated. The AFM locus was used as a negative control. *P < 0.05 (Student’s t-test). Data are representative of three independent experiments (mean and s.d.) with cells derived from different donors. (f) Dual-luciferase assay of HEK-293T cells transfected with luciferase constructs containing wild-type (WT) 3′ UTR or mutated (Mut) 3′ UTR of SATB1 (with mutation of the miRNA-responsive elements), together with synthetic mature miRNAs or a synthetic control miRNA (Ctrl). *P < 0.05 (Student’s t-test). Data are representative of three independent experiments (mean and s.d.). (g) Immunoblotting for SATB1 (top) and Erk1, Erk2 (bottom) in Treg from mice with a Treg-specific complete DICER loss (Dicer1fl/fl) in comparison to Dicer1+/fl Treg. Data are representative of two independent experiments.
Figure 8
Figure 8. Ectopic expression of SATB1 in Treg results in reduced suppressive function in vivo
(a) Suppression of CD4+ T cells, labeled with the cytosolic dye eFluor 670 (Tconv cells) cultured with CD3+CD28-coated beads by expanded mouse Treg lentivirally transduced with SATB1 (SATB1, blue) or control vector (Ctrl, red), presented as percent proliferating Tconv cells versus the Treg cell/Tconv cell ratio (right). (b) Relative IL-5 (left) and IFN-γ mRNA expression (right) in murine Treg lentivirally transduced with SATB1 (SATB1, blue) or control vector (Ctrl, red). (c) Hematoxylin and eosin staining of colon sections from Rag2−/− mice at 9 weeks after the transfer of CD4+CD45RBhi naive T cells (naïve T) alone or in combination with control-transduced Treg (Treg cells (Ctrl)) or SATB1-transduced Treg (Treg cells (SATB1)). Original magnification, ×200; scale bars, 100 µm. (d) Histology scores of colon sections of Rag2−/− mice at 9 weeks after the transfer in c. (e) Body weight of Rag2−/− mice at 9 weeks after the transfer in c, presented relative to initial body weight. (f,g) Recovery of Tconv (f) and Treg (g) from spleens, mesenteric, and peripheral lymph nodes of Rag2−/− mice at 9 weeks after the transfer in c. *P < 0.05 (Student’s t-test). NS, not significant. Data are representative of three independent experiments (b; mean and s.d.), two independent experiments (a; mean and s.e.m. of triplicate cultures), or are pooled from two independent experiments (c–g; mean and s.d. of four resp. five recipient mice).

References

    1. Sakaguchi S, Yamaguchi T, Nomura T, Ono M. Regulatory T cells and immune tolerance. Cell. 2008;133:775–787. - PubMed
    1. Lin W, et al. Regulatory T cell development in the absence of functional Foxp3. Nat Immunol. 2007;8:359–368. - PubMed
    1. Wan YY, Flavell RA. Regulatory T-cell functions are subverted and converted owing to attenuated Foxp3 expression. Nature. 2007;445:766–770. - PubMed
    1. Lahl K, et al. Nonfunctional regulatory T cells and defective control of Th2 cytokine production in natural scurfy mutant mice. J Immunol. 2009;183:5662–5672. - PubMed
    1. Williams LM, Rudensky AY. Maintenance of the Foxp3-dependent developmental program in mature regulatory T cells requires continued expression of Foxp3. Nat Immunol. 2007;8:277–284. - PubMed

Publication types

MeSH terms

Associated data