. 2011 Sep;3(9):910-21.
doi: 10.1039/c1ib00043h. Epub 2011 Aug 15.

In situ force mapping of mammary gland transformation

Affiliations

In situ force mapping of mammary gland transformation

Jose I Lopez et al. Integr Biol (Camb). 2011 Sep.

Abstract

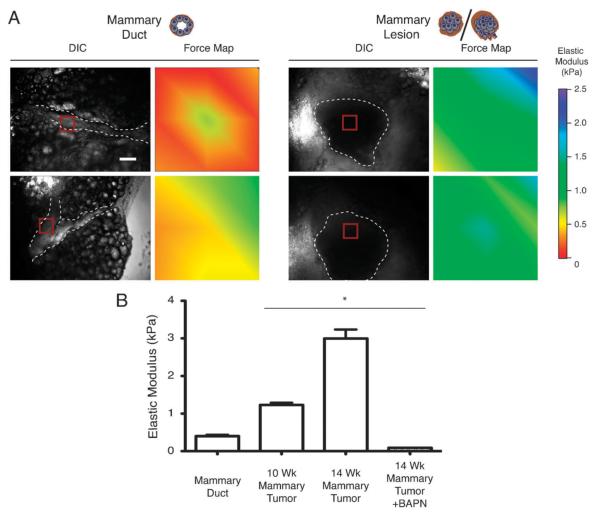
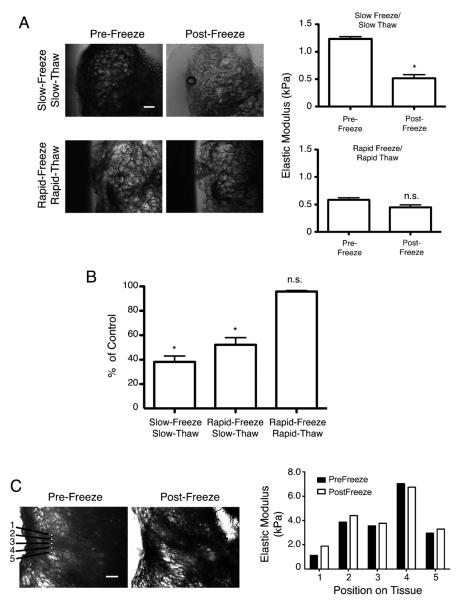
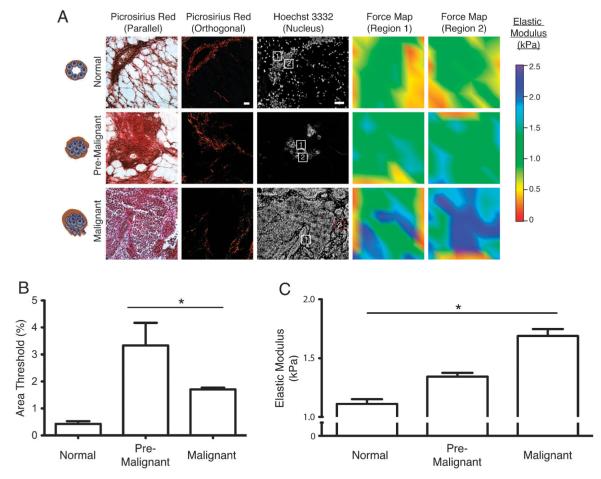
Tumor progression is characterized by an incremental stiffening of the tissue. The importance of tissue rigidity to cancer is appreciated, yet the contribution of specific tissue elements to tumor stiffening and their physiological significance remains unclear. We performed high-resolution atomic force microscopy indentation in live and snap-frozen fluorescently labeled mammary tissues to explore the origin of the tissue stiffening associated with mammary tumor development in PyMT mice. The tumor epithelium, the tumor-associated vasculature and the extracellular matrix all contributed to mammary gland stiffening as it transitioned from normal to invasive carcinoma. Consistent with the concept that extracellular matrix stiffness modifies cell tension, we found that isolated transformed mammary epithelial cells were intrinsically stiffer than their normal counterparts but that the malignant epithelium in situ was far stiffer than isolated breast tumor cells. Moreover, using an in situ vitrification approach, we determined that the extracellular matrix adjacent to the epithelium progressively stiffened as tissue evolved from normal through benign to an invasive state. Importantly, we also noted that there was significant mechanical heterogeneity within the transformed tissue both in the epithelium and the tumor-associated neovasculature. The vascular bed within the tumor core was substantially stiffer than the large patent vessels at the invasive front that are surrounded by the stiffest extracellular matrix. These findings clarify the contribution of individual mammary gland tissue elements to the altered biomechanical landscape of cancerous tissues and emphasize the importance of studying cancer cell evolution under conditions that preserve native interactions.


Figures

Fig. 1
Fig. 1
In situ biomechanical characterization reveals mammary tumors are stiffer than normal mammary ducts. (A) Representative DIC microscopy images showing mammary gland ducts (left column, dashed line) as compared to mammary lesions (right column, dashed line). AFM indentations were performed in 90 × 90 μm areas (red square) and the measurements obtained within this area are represented as a force heat map. Scale bar = 100 μm. (B) Bar graph demonstrating the average Young’s elastic modulus calculated from force map measurements (see A). Error bars represent average ± S.E.M. *P < 0.001. Graphs represent compiled measurements taken from at least 5 mice. Each force map is made up of 36 indentations.
Fig. 2
Fig. 2
In situ biomechanical characterization reveals mechanical stiffening and heterogeneity of the tumor epithelium. (A) Representative fluorescence microscopy images showing mammary gland epithelium (green) tagged in the ACTB-ECFP transgenic mouse. AFM indentations were performed in 90 × 90 μm areas (white squares) and the measurements obtained within this area are represented as a force heat map. Scale bar = 100 μm. (B) Bar graph representing the Young’s elastic modulus obtained by AFM indentation of in situ epithelium (left) or ex vivo cultured epithelium (right). Error bars represent average ± S.E.M. *P < 0.05. Graphs represent compiled measurements taken from at least 8 mice. Each force map is made up of 36 indentations.
Fig. 3
Fig. 3
In situ biomechanical characterization reveals stiffening and mechanical heterogeneity of the tumor-associated vasculature. (A) Representative fluorescence microscopy images showing tissue vasculature labeled by Rh-lectin perfusion (red) and mammary gland epithelium (green) tagged in the ACTB-ECFP transgenic mouse. AFM indentations were performed in 90 × 90 μm areas (white square) and the measurements obtained within this area are represented as a force heat map. Only measurements corresponding to the vasculature (enclosed by dashed lines) were used during quantification. Scale bar = 100 μm. (B) Bar graph representing the Young’s elastic modulus obtained from in situ vascular measurements obtained in (A). Error bars represent average ± S.E.M. *P < 0.05. (C) Representative fluorescent microscopy image showing CD31-stained vascluature (green) or patent vessel labeling by Rh-lectin (red). Adipose vessels with weak CD31 staining are indicated with arrows. CD31 stained, tumor-associated vessels that are not patent are indicated by arrowheads. Delineation of tumor center and tumor front is indicated by dashed line. Scale bar = 240 μm for upper panel and 120 μm for lower panel. Graphs represent compiled measurements taken from at least 12 mice. Each force map is made up of 100 indentations.
Fig. 4
Fig. 4
A novel vitrification approach to characterize ECM stiffness in situ. (A) DIC microscopy images showing rapid or slow frozen mammary gland tissues (left). Scale bar = 100 μm. Bar graph indicates the Young’s elastic modulus calculated from frozen mammary gland tissues (right). Error bars represent average ± S.E.M. *P < 0.05. (B) Bar graph quantifying changes in tissue Young’s elastic modulus when frozen by three different methods. Error bars represent average ± S.E.M. *P < 0.05. Graphs represent compiled measurements taken from at least 3 tissues. Each tissue was indented in 36 unique areas. (C) DIC microscopy images indicating five regions where AFM indentation was performed pre- and post-freezing (left). Scale bar = 100 μm. Bar graph quantifying changes in the Young’s elastic modulus calculated from points (right). Error bars represent average ± S.E.M. *P < 0.05.
Fig. 5
Fig. 5
In situ biomechanical characterization reveals progressive ECM stiffening during tumor progression. (A) Picrosirius red microscopy viewed under parallel or orthogonal polarizing filters taken from mammary gland cryopreserved sections reveal the fibrillar collagen. Cell nuclei were identified by staining with Hoechst 3332. AFM indentations were performed in 90 × 90 μm areas (white squares) corresponding to ECM adjacent to the epithelium and the measurements obtained within this area are represented as a force heat map. Scale bar = 100 μm. (B) Bar graph representing quantification of fibrillar collagen deposition in tissues surrounding the mammary epithelium as % area threshold. Error bars represent average ± S.E.M. *P < 0.05. (C) Bar graph representing Young’s elastic modulus of the fibrillar collagen adjacent to epithelium. Error bars represent average ± S.E.M. *P < 0.05. Graphs represent compiled measurements taken from at least 7 mice. Each force map is made up of 100 indentations.

References

    1. Butcher DT, Alliston T, Weaver VM. A tense situation: forcing tumour progression. Nat. Rev. Cancer. 2009;9:108–122. - PMC - PubMed
    1. Levental KR, et al. Matrix crosslinking forces tumor progression by enhancing integrin signaling. Cell. 2009;139:891–906. - PMC - PubMed
    1. Polyak K. Breast cancer gene discovery. Expert Rev. Mol. Med. 2002;4:1–18. - PubMed
    1. Chambers AF, Groom AC, MacDonald IC. Dissemination and growth of cancer cells in metastatic sites. Nat. Rev. Cancer. 2002;2:563–572. - PubMed
    1. Wiseman BS, Werb Z. Stromal effects on mammary gland development and breast cancer. Science. 2002;296:1046–1049. - PMC - PubMed

Publication types

MeSH terms