. 2011 Oct 14;13(38):16902-11.
doi: 10.1039/c1cp21541h. Epub 2011 Aug 15.

Diffusion models of protein folding

Affiliations

Diffusion models of protein folding

Robert B Best et al. Phys Chem Chem Phys. .

Abstract

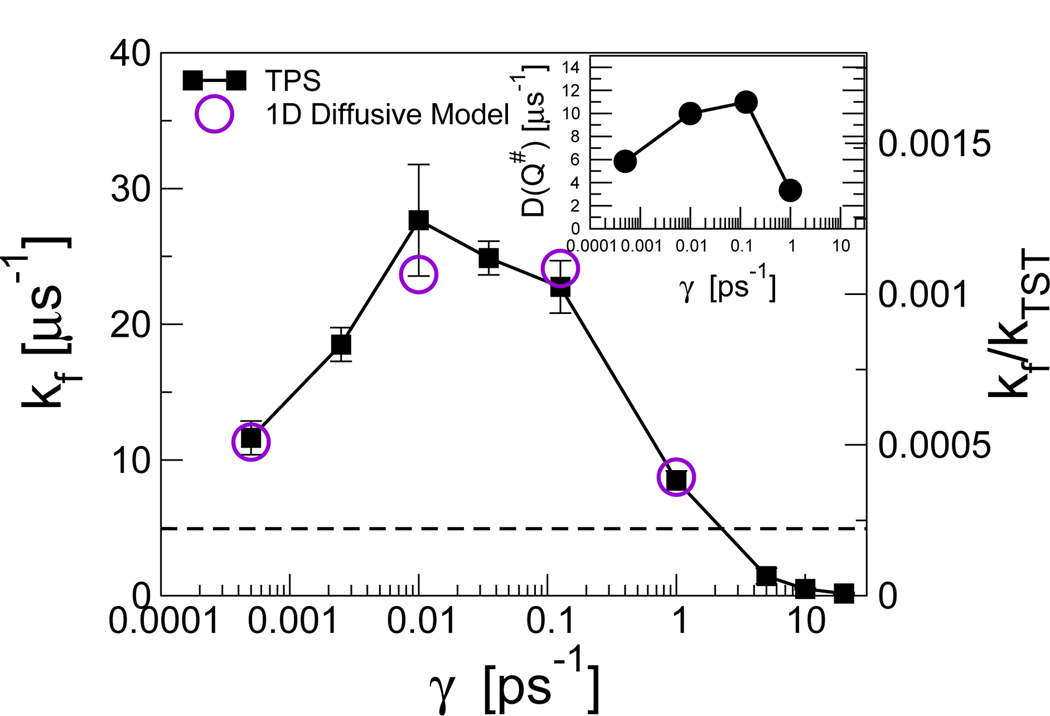
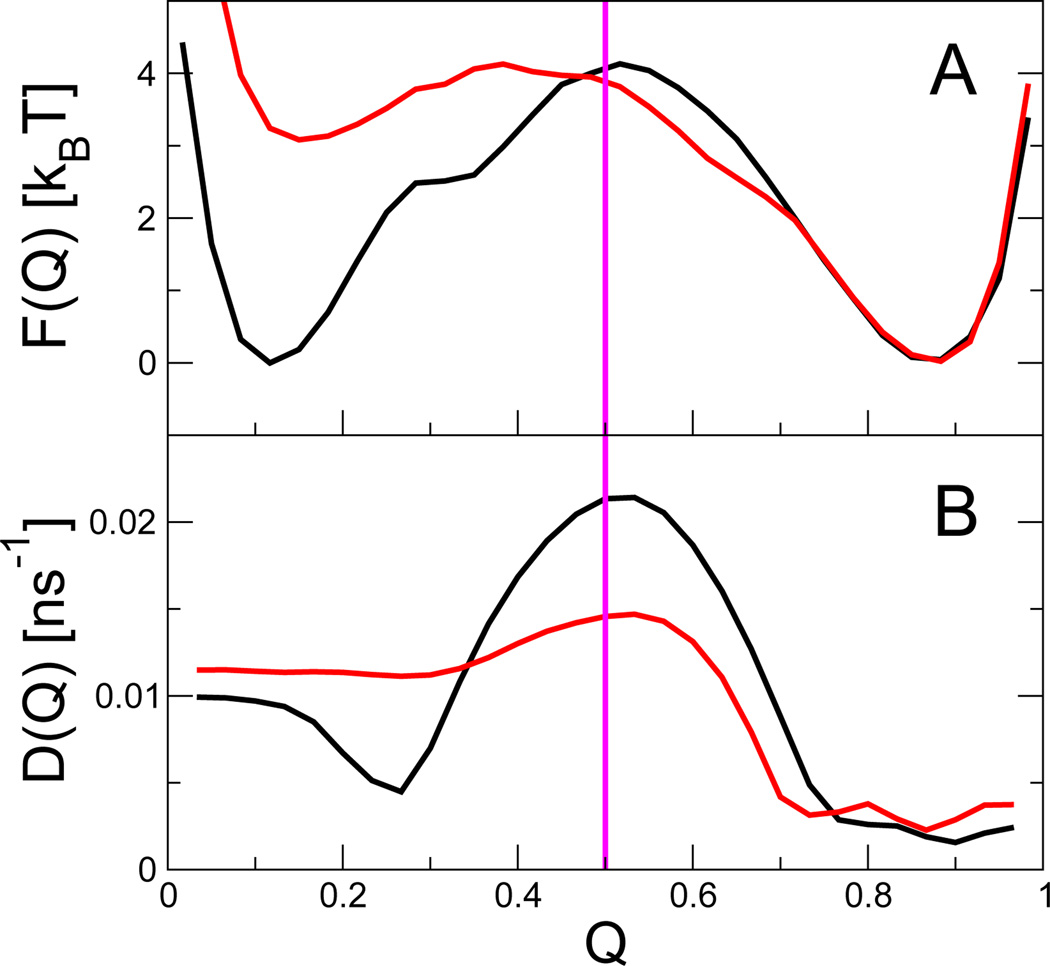
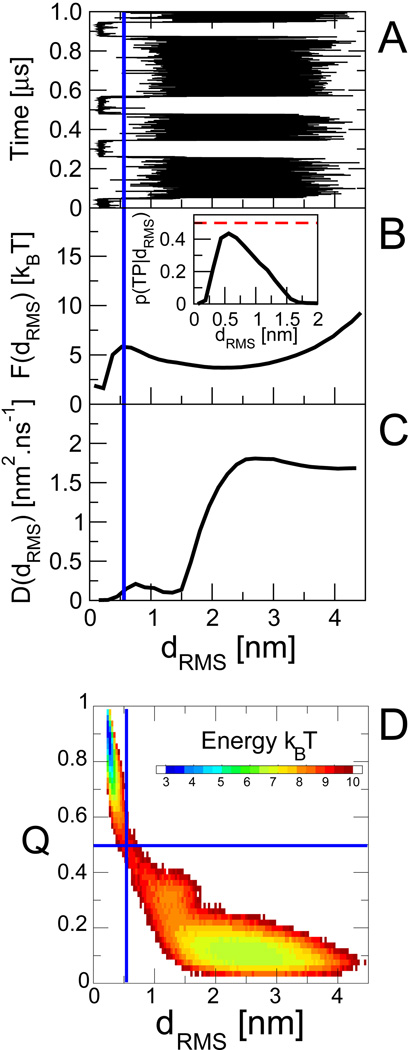
In theory and in the analysis of experiments, protein folding is often described as diffusion along a single coordinate. We explore here the application of a one-dimensional diffusion model to interpret simulations of protein folding, where the parameters of a model that "best" describes the simulation trajectories are determined using a Bayesian analysis. We discuss the requirements for such a model to be a good approximation to the global dynamics, and several methods for testing its accuracy. For example, one test considers the effect of an added bias potential on the fitted free energies and diffusion coefficients. Such a bias may also be used to extend our approach to determining parameters for the model to systems that would not normally explore the full coordinate range on accessible time scales. Alternatively, the propagators predicted from the model at different "lag" times may be compared with observations from simulation. We then present some applications of the model to protein folding, including Kramers-like turnover in folding rates of coarse-grained models, the effect of non-native interactions on folding, and the effect of the chosen coordinate on the observed position-dependence of the diffusion coefficients. Lastly, we consider how our results are useful for the interpretation of experiments, and how this type of Bayesian analysis may eventually be applied directly to analyse experimental data.


Figures

Fig. 1
Fig. 1
Folding dynamics of protein G Gō model (protein structure shown, lower right). (A) Example of an equilibrium folding trajectory projected onto the fraction of native contacts, Q; (B) Probability of being on a transition path, p(TP|Q), with dashed horizontal line indicating the theoretical maximum for diffusive dynamics. The blue dashed line shows p(TP|Q) calculated from the 1D diffusion model. Simulation details in ref .
Fig. 2
Fig. 2
Construction of diffusive models. (A) Dependence of the slowest relaxation rate, given by the negative of the first non-zero eigenvalue λ2 of the diffusion operator, on the “lag time” Δt for the protein G Gō model. The inset shows the Q autocorrelation function CQQ(t), whose relaxation rate kQ is given by the broken red line in the main panel. For a lag time of 2 ns (blue arrow in (A), the resulting position-dependent free energies F(Q) and diffusion coefficients are shown in Fig. 3 A and B, respectively. (B) Cumulative distribution of transition path durations for protein G Gō model. The inset shows the corresponding probability density on a linear scale.
Fig. 3
Fig. 3
Free energy and diffusion coefficient for protein G Gō model. (A) Free energy F(Q) from unbiased simulations (black) and from simulations with an added biasing potential V(Q) = −F(Q) (red). (B) Diffusion coefficients D(Q) from equilibrium simulations on the unbiased surface (black), and on the biased surface (red), obtained with a smoothening prior and ε = 10−3 ns−1. The green squares show F(Q) (hidden) and D(Q) obtained without such a prior.
Fig. 4
Fig. 4
Dynamics at the top of the folding barrier. Propagators p(Q, t|Q0 = 0.52, 0) are shown for simulations (open circles) on the flat surface with V(Q) = −F(Q) added (left panels) and for the unperturbed system (right panels), collected at times t = 0.25, 0.5, 1, and 2 ns (top to bottom). Red lines are the predictions of the diffusion model, eqn (1), and blue lines are Gaussian fits based on the actual mean and variance.
Fig. 5
Fig. 5
Apparent Kramers turnover in friction-dependent folding rate kf(γ) for three-helix bundle prb7–53. Rates from transition path sampling and the diffusive model are indicated by filled squares and empty circles, respectively. The horizontal dashed line indicates the limiting rate for Hamiltonian dynamics, i.e., for γ = 0 (without friction). The inset shows the corresponding turnover in friction-dependent diffusion coefficients at the barrier top, D(Q;γ). Data from ref .
Fig. 6
Fig. 6
Effect of adding non-Gō contacts to the (A) free energies and (B) diffusion coefficients for protein G. Black and red curves correspond to the original Gō model, and to the model with added non-Gō interactions, respectively. Data from ref .
Fig. 7
Fig. 7
Dynamics and free energy for dRMS reaction coordinate. (A) Projection of the trajectories onto dRMS. Corresponding position-dependent free energies (B) and diffusion coefficients (C) obtained from Bayesian fitting. (D) Two-dimensional potential of mean force F(dRMS,Q), showing the relationship between the two coordinates. Data from ref .

References

    1. Snow CD, Nguyen H, Pande VS, Gruebele M. Nature. 2002;420:102–106. - PubMed
    1. Freddolino PL, Schulten K. Biophys. J. 2009;97:2338–2347. - PMC - PubMed
    1. Shaw DE, Maragakis P, Lindorff-Larsen K, Piana S, Dror RO, Eastwood MP, Bank JA, Jumper JM, Salmon JK, Shan Y, Wriggers W. Science. 2010;330:341–346. - PubMed
    1. Bryngelson JD, Wolynes PG. J. Phys. Chem. 1989;93:6902–6915.
    1. Camacho CJ, Thirumalai D. Proc. Natl. Acad. Sci. U. S. A. 1993;90:6369–6372. - PMC - PubMed

Publication types