Review
. 2011 Sep 22;23(36):H217-47.
doi: 10.1002/adma.201102313. Epub 2011 Aug 15.

Cancer nanotheranostics: improving imaging and therapy by targeted delivery across biological barriers

Affiliations
Review

Cancer nanotheranostics: improving imaging and therapy by targeted delivery across biological barriers

Forrest M Kievit et al. Adv Mater. .

Abstract

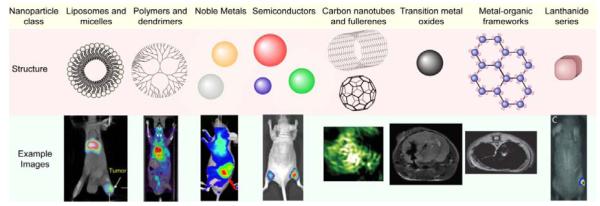
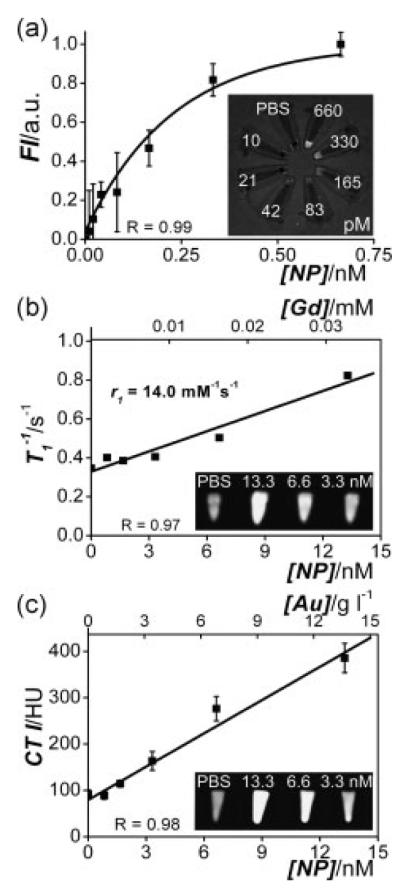
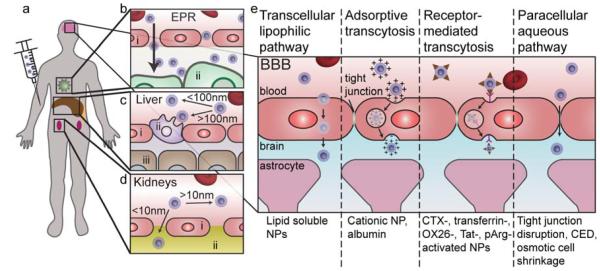
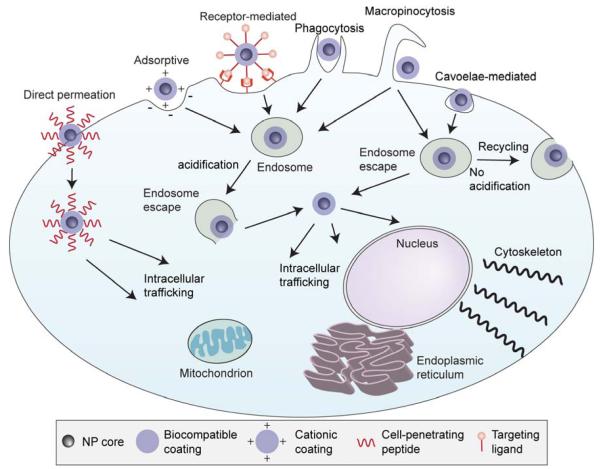
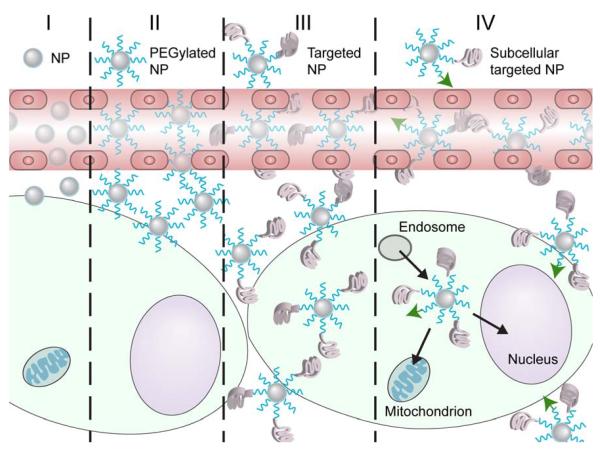
Cancer nanotheranostics aims to combine imaging and therapy of cancer through use of nanotechnology. The ability to engineer nanomaterials to interact with cancer cells at the molecular level can significantly improve the effectiveness and specificity of therapy to cancers that are currently difficult to treat. In particular, metastatic cancers, drug-resistant cancers, and cancer stem cells impose the greatest therapeutic challenge for targeted therapy. Targeted therapy can be achieved with appropriately designed drug delivery vehicles such as nanoparticles, adult stem cells, or T cells in immunotherapy. In this article, we first review the different types of nanotheranostic particles and their use in imaging, followed by the biological barriers they must bypass to reach the target cancer cells, including the blood, liver, kidneys, spleen, and particularly the blood-brain barrier. We then review how nanotheranostics can be used to improve targeted delivery and treatment of cancer cells. Finally, we discuss development of nanoparticles to overcome current limitations in cancer therapy.


Figures

Figure 1
Figure 1
Typical nanomaterial formulations for imaging and therapy of cancers, their mechanism for imaging, and associated representative images. Example images reproduced with permission for liposomes and micelles (SPECT image overlaid with CT),[15] polymers and dendrimers (PET image overlaid with CT),[275] noble metals (near-IR optical imaging),[276] semiconductors (fluorescence imaging),[32] carbon nanotubes and fullerenes (photoacoustic imaging),[35] transition metal oxides (MRI),[81] metal-organic frameworks (MRI),[51] and lanthanide series (X-ray radioluminescence imaging).[57]
Figure 2
Figure 2
Concentration–signal curves of the lipid-coated gold/silica particles for (a) FI, (b) MRI and (c) CT. Note that both nanoparticle concentrations and the corresponding Gd and Au concentrations are given. The molar longitudinal relaxivity r1 of the gadolinium in the lipids was found to be 14.0 mM−1 s−1 and the slope in the CT curve was 23 HU per g gold l−1 solution. The inset in each panel shows the corresponding image of nanoparticle dilution series (concentrations indicated) associated with each imaging modality, revealing the high sensitivities of all three imaging techniques. Reproduced with permission.[62]
Figure 3
Figure 3
Physiological barriers encountered by NPs. a) Upon injection into the blood, NPs circulate throughout the body reaching the capillaries of the liver, kidneys, tumor, and brain. b) Passive accumulation in the tumor occurs with NPs with hydrodynamic diameters between 30–200 nm. i) endothelial cell, ii) tumor cell. c) The Kupffer cells of the liver readily recognize materials with hydrodynamic diameters larger than 100 nm and removes them from circulation. i) endothelial cell, ii) Kupffer cell, iii) hepatocyte. d) The pores of the glomerulus in the kidneys are around 10 nm and thus materials with hydrodynamic diameters larger than this will avoid renal filtration. i) endothelial cell, ii) glomerular basement membrane. e) The blood-brain barrier (BBB) prevents passive accumulation of materials in the brain due to tight junctions between endothelial cells, and thus active or disruptive mechanisms must be used to bypass the BBB.
Figure 4
Figure 4
Cellular barriers encountered by NPs. Entry into the cell across the cell membrane can occur by direct permeation, or by various types of endocytosis mechanisms. Upon endocytosis, the NP must escape the endosome before acidification degrades the payload or the NP is exocytosed with membrane recycling. After the NP gains access to the cytoplasm of the cell, intracellular trafficking will ensure that the therapeutic payload will reach the desired site of action such as the mitochondria, endoplasmic reticulum, nucleus, or cytoskeleton.
Figure 5
Figure 5
Targeting strategies to improve NP delivery throughout the tumor. I) Non-PEGylated NPs accumulate in the tumor site through the EPR effect. II) PEGylated NPs show enhanced accumulation in the tumor site through the EPR effect. III) Targeted NPs show better distribution throughout the tumor and higher cellular uptake. IV) Subcellular targeting increases NP delivery to the intracellular site of action of the drug.
Figure 6
Figure 6
In vivo distribution of HFT-T in KB-3-1 tumor-bearing mice. Near infrared dye (cy5.5)-labeled HFT-T or HT-T was injected i.v. into KB-3-1 tumor-bearing mice. (a) Imaging of mice at 1, 24, and 48 h after injection. (b) Biodistribution of HFT-T and HT-T in major organs at 48 h after injection. (c) The cellular internalization of HFT-T versus HT-T in KB-3-1 xenografts 24 h after injection (i.v.). HFT-T showed marked internalization in KB-3-1 cells identified by human EpCAM expression (green). In contrast, HT-T showed much less internalization by KB-3-1 cells and was predominantly found in the extracellular space. (d) Flow cytometry analyses of cells obtained from disaggregated KB-3-1 xenografts 24 h after i.v. injection of HFT-T or HT-T. Two-dimensional event density plots of disaggregated tumor cell suspensions from animals injected with HFT-T or HT-T. The cells were stained with anti-EpCAM Ab-FITC conjugate to identify human cancer cells. The cells in Q4-2 and Q2-2 were human tumor cells (EpCAM positive), the cells in Q1-2 and Q2-2 contained nanoparticles (bodipy 564 positive), and the cells in Q2-2 were human tumor cells containing nanoparticles (double positive). Reproduced with permission.[136] Copyright 2009, American Chemical Society.
Figure 7
Figure 7
Intravenously-delivered superparamagnetic iron oxide (SPIO) NP-loaded MSCs localize to lung metastases and can be visualized by MRI. (A) Representative coronal MRI sections (n = 4 mice) of a normal mouse lung (Normal), mouse lung with metastases 35 d after i.v. delivery of MDAMB231 cells (pre-MSC), and the same mouse lung 1 h after SPIO-loaded MSC injection (post-MSC). The metastases (circled) are visualized as focal regions of increased signal. These areas correspond to metastases on H&E histologic sections (bar, 100 μm). One hour after SPIO-loaded MSC injection, there is a decrease in signal intensity caused by the iron oxide in MSCs (+, ribcage; *, trachea; ^, diaphragm with upper abdomen below; ~, fissure separating lobes). (B) The reduction in signal intensity secondary to the NP-loaded MSCs 1 and 24 h after MSC injection was further confirmed and quantified by comparing signal-to-noise ratio (SNR) between the lung parenchyma and the deltoid muscle in three consecutive MR slices in three mice; there was a significant (P = 0.005) reduction in SNR across all four radiological areas [left upper (LU), left lower (LL), right upper (RU), and right lower (RL)]. (C) Tumor histology from mice harvested at day 35, 1 h after NP-loaded MSC injection and MRI. Prussian blue (i) and DiI staining (ii; red) on contiguous sections from mice, showing that MSCs migrate to and incorporate into lung metastases after i.v. delivery (bar, 20 μm). iii, macrophage immunohistochemistry (brown) stains different cells from NP-loaded cells (blue stain). iv, macrophage immunofluorescence (green) stains different cells from DiI-labeled (red) cells (bar, 5 μm). Reproduced with permission.[164] Copyright 2009 American Association for Cancer Research.
Figure 8
Figure 8
In vivo MRI detection of labeled lymphocytes in a mouse tumor. a,b: Sequential MR images (3D-SPGR, voxel (60 μm)3) of the tumor in mice 48 h after injection of three million unlabeled lymphocytes (a) or the same number of magnetically labeled cells (b; iron load 1.3 pg/cell at the time of injection). Control tumors (a) give a homogeneous signal, whereas punctuate signal voids (white arrows) distributed throughout the tumor are observed in tumors of mice that received labeled lymphocytes (b). c,d: Zoom of the tumor image containing a signal void (d; labeled lymphocytes) or no signal void (c; control). Reproduced with permission.[175]
Figure 9
Figure 9
Lung and bone marrow tumors were established by tail vein injection of 1 × 10⁶ extG-luc–expressing B16F10 cells into C57BL/6 mice. Tumor-bearing mice were treated after 1 week by sublethal irradiation followed by i.v. infusion of 1 × 10⁷ CBR-luc–expressing Vβ13+CD8+ Pmel-1 T cells. One group of mice received Pmel-1 T cells conjugated with 100 nanoparticles per cell carrying a total dose of 5 μg IL-15Sa and IL-21 (4.03 μg IL-15Sa + 0.93 μg IL-21); control groups received unmodified Pmel-1 T cells and a single systemic injection of the same doses of IL-15Sa and IL-21 or Pmel-1 T cells alone. (a) Dual longitudinal in vivo bioluminescence imaging of extG-luc–expressing B16F10 tumors and CBR-luc–expressing Pmel-1 T cells. (b) Frequencies of Vβ13+CD8+ Pmel-1 T cells recovered from pooled lymph nodes of representative mice 16 d after T cell transfer. (c) CBR-luc T cell signal intensities from sequential bioluminescence imaging every 2 d after T cell transfer. Every line represents one mouse, with each dot showing the whole-mouse photon count. (d) Survival of mice after T cell therapy illustrated by Kaplan-Meier curves. Shown are six mice per treatment group pooled from three independent experiments. Reproduced with permission.[176] Copyright 2010, Nature Publishing Group.
Figure 10
Figure 10
MRI images of lymph nodes. (a) MRI before vaccination; the inguinal lymph node to be injected is indicated with a black arrow. (b) MRI after injection showing that the dendritic cells were not accurately delivered into the inguinal lymph node (black arrow) but in the vicinity, in the subcutaneous fat (white arrow). Reproduced with permission.[181] Copyright 2005, Nature Publishing Group.
Figure 11
Figure 11
Structure of a virus-like particle (VLP) presenting antigens for immune activation. The size of the VLP ensures efficient trafficking to and recognition by the immune system for activation. Its ability to package ligands and its highly repetitive surface display of epitopes enable efficient activation of both complement and innate immunity. Adapted from.[189]
Figure 12
Figure 12
Polyhydroxylated nanoparticle surfaces activate complement. (a) Synthesis and stabilization with two different forms of Pluronic allowed the generation of polyhydroxylated- or polymethoxylated-nanoparticles. (b) The, -terminal OH groups on Pluronic could be converted to OCH3 groups. (c) The proposed mechanism where OH groups on the polyhydroxylated nanoparticles can bind to the exposed thioester of C3b to activate complement by the alternative pathway. (d) Nanoparticle-induced complement activation, as measured through C3a presence in human serum after incubation with nanoparticles, was demonstrated to be high with polyhydroxylated nanoparticles but low with polymethoxylated nanoparticles (OH- and CH3O-NPs, respectively). Results are normalized to control of serum incubation with PBS. Values are means of three independent experiments; error bars correspond to standard error of mean, s.e.m. Reproduced with permission.[200] Copyright 2007, Nature Publishing Group.
Figure 13
Figure 13
T2-weighted image of tumor-bearing mouse injected with pluronic F127-modifed magnetic NPs. Enhanced contrast in the tumor (denoted by arrow) is apparent 4 min after the initial injection and is more pronounced at 68 min after a second injection of the MNPs. Images were analyzed for signal intensity in the tumor with Amira software (Visage Imaging, Inc., San Diego, CA). Reproduced with permission.[208] Copyright 2009 Elsevier.
Figure 14
Figure 14
Multifunctional nanoemulsion used as a nanotheranostic NP provides image guided therapy in a mouse model of colon cancer. The oil-in-water nanoemulsion comprises iron oxide NPs for MRI, Cy7 fluorophore for optical near-infrared fluorophore (NIRF) imaging, and PAV for therapy. Reproduced with permission.[211] Copyright 2011, American Chemical Society.
Figure 15
Figure 15
Tumor growth/metastasis inhibition by nanoparticles containing siRNA and miRNA. (a) Images of the B16F10 tumor-bearing lungs on day 19 after two consecutive i.v. injections of siRNAs or miRNA in different formulations. (b) Luciferase activity in the tumor-bearing lungs on day 19 after two consecutive i.v. injections on days 8 and 9 of siRNAs and miRNA in different formulations. n = 5–6. ***P < 0.001. Formulations: untreated control (1), combined siRNAs and control miRNA in the GC4-targeted nanoparticles (2), control siRNA and miR-34a in the GC4-targeted nanoparticles (3), combined siRNAs and miR-34a in the control-targeted nanoparticles (4), and combined siRNAs and miR-34a in the GC4-targeted nanoparticles (5). Dose = 0.6 mg total RNA/kg. Combined siRNAs = c-Myc:MDM2:VEGF (1:1:1), siRNA:miRNA = 1:1, weight ratios. Reproduced with permission.[227] Copyright 2010, Nature Publishing Group.
Figure 16
Figure 16
Time course study of intracellular retention of fluorescent-labeled Tx in MCF-7 cells. Cells were treated with drug in solution (Tx-Sol) or unconjugated drug-loaded NPs (Tx-NPs) or Tf-conjugated NPs (Tx-NPs-Tf) (dose = 10 ng/mL) in the growth medium. Cells treated with Tx-Sol showed a decrease in green fluorescence intensity of the drug with incubation time whereas Tx-NPs and Tx-NPs-Tf demonstrated an increase, with Tf-conjugated NPs demonstrating the fluorescence of the drug lasting up to 8 days. N = nucleus. Reproduced with permission.[244] Copyright 2005, American Chemical Society.
Figure 17
Figure 17
Treatment of cancer stem cells (CSCs). Standard chemotherapy agents debulk the tumor, but can leave residual drug resistant CSCs which will lead to relapse. A CSC targeted therapy that can selectively and efficiently kill the CSCs will leave a benign mass.

References

    1. World Health Organization; Geneva: 2011.
    1. Mehlen P, Puisieux A. Nat Rev Cancer. 2006;6:449. - PubMed
    1. Szakacs G, Paterson JK, Ludwig JA, Booth-Genthe C, Gottesman MM. Nat Rev Drug Discov. 2006;5:219. - PubMed
    1. Cho KJ, Wang X, Nie SM, Chen Z, Shin DM. Clin. Cancer Res. 2008;14:1310. - PubMed
    1. Brindle K. Nat. Rev. Cancer. 2008;8:94. - PubMed

Publication types