. 2011 Sep 27;5(9):7555-64.
doi: 10.1021/nn202554t. Epub 2011 Aug 17.

Facile assembly of micro- and nanoarrays for sensing with natural cell membranes

Affiliations

Facile assembly of micro- and nanoarrays for sensing with natural cell membranes

Nathan J Wittenberg et al. ACS Nano. .

Abstract

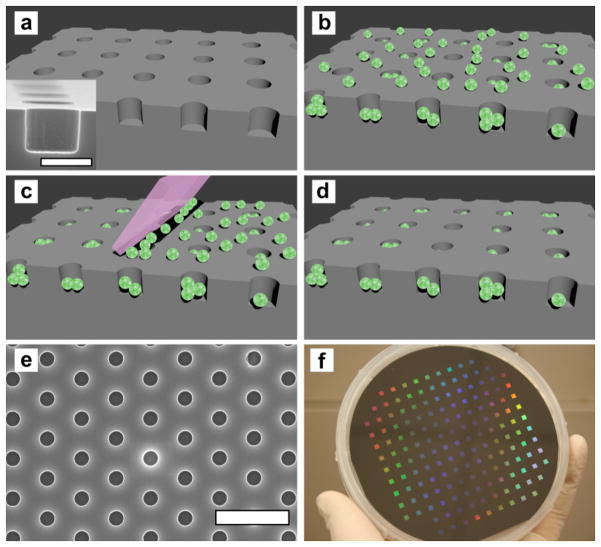
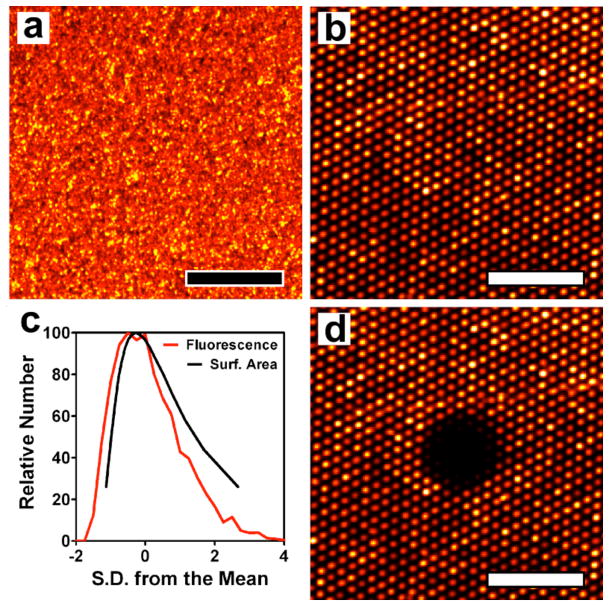
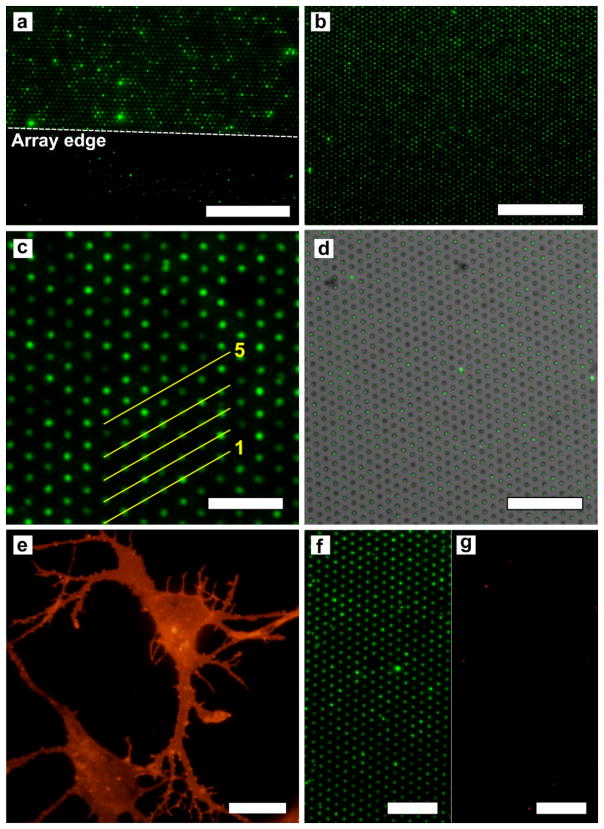
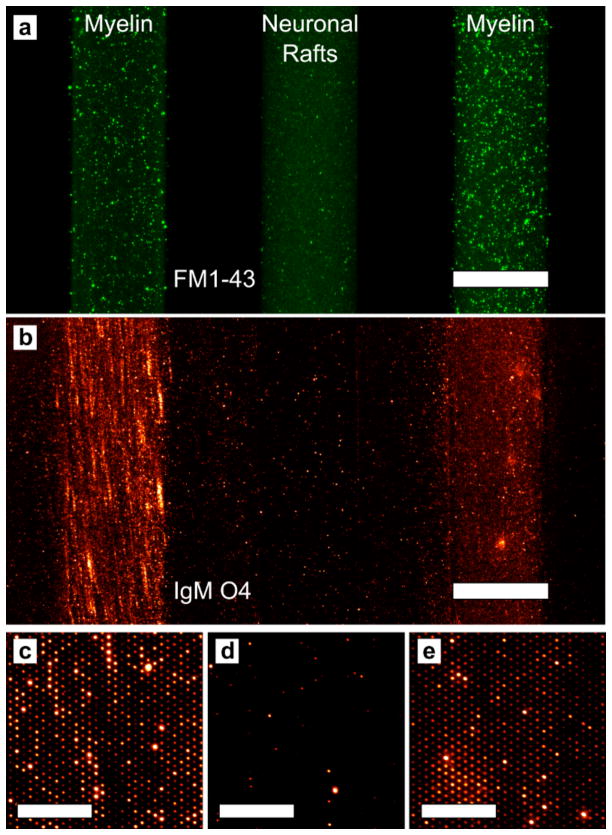
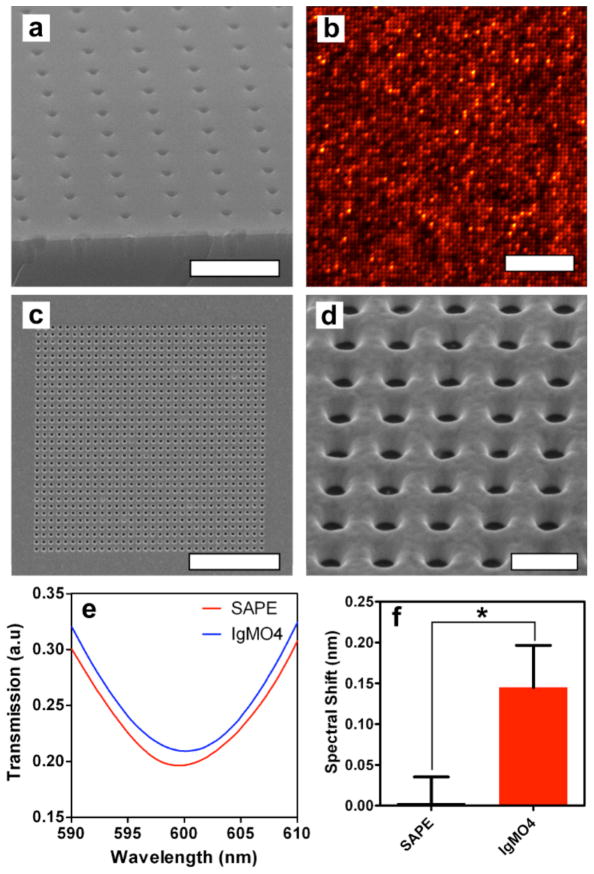
Microarray technology has facilitated many powerful high-throughput studies in the fields of genetics and proteomics, among others. However, preparation of microarrays composed of cell-derived membranes with embedded receptors has proven difficult. Here we describe a new method for forming microarrays composed of synthetic lipid vesicles and natural cell membranes. The method is based upon assembly of vesicles and natural membranes into recessed micro- and nanowells and using a polydimethylsiloxane (PDMS) block as a "squeegee." This method is used to assemble phospholipid vesicles into arrays with micrometer and nanoscale dimensions. Native myelin and neuronal lipid raft arrays are also formed in 30 min or less. We show the natural membrane arrays can be used for sensing lipid-protein interactions by detecting cholera toxin binding to ganglioside GM1 in neuronal lipid rafts. In multicomponent arrays myelin can be distinguished from neuronal rafts by antibody binding to cell-specific surface antigens. Finally, myelin arrays formed in gold nanowells are used for surface plasmon resonance sensing. This assembly approach is simple, broadly applicable, and opens up new avenues of research not easily accomplished with standard microarray technology.


Figures

Figure 1
Figure 1
Schematic illustration of the array assembly process and images of microwell substrates. (a) Illustration of an array of wells in an Al2O3-coated silicon substrate. Inset: A cross sectional SEM image of a microwell. The scale bar is 1 μm. (b) Vesicles are deposited on the substrate and fill the wells as well as populate the top surface. (c) The PDMS block “squeegee” is translated across the substrate, removing vesicles that are not immobilized in the recessed wells. (d) After using the squeegee, the top surface of the substrate is devoid of vesicles, while the recessed wells are filled. (e) SEM image of a hexagonal microwell array with 1 μm well diameter and 3 μm periodicity. The scale bar is 5 μm. (f) Photograph of a 4 inch wafer patterned with 157 microwell arrays, each with 1 μm well diameter and depth and 3 μm periodicity.
Figure 2
Figure 2
Fluorescence images of a phospholipid vesicle microarray. (a) A microarray uniformly covered with Rho-PE-labeled egg PC vesicles before applying the PDMS squeegee. (b) A microarray after applying the squeegee showing 1 μm-diameter wells with 3 μm periodicity filled with vesicles. (c) Distribution of average fluorescence intensity (red) from 5200 microarray wells and the distribution of surface area (black) of vesicles extruded 21 passes through a 200 nm polycarbonate filter determined by dynamic light scattering. (d) Fluorescence image of the microarray in (b) 2 minutes after photobleaching a 25 μm-diameter area showing no fluorescence recovery. This indicates the material in the wells is isolated and that a supported lipid bilayer does not form spontaneously. The scale bars in a, b and d are 25 μm.
Figure 3
Figure 3
Fluorescence images of natural membrane microarrays stained with FM1-43 and GM1 detection with CTX. (a) Myelin microarray showing the array edge, which is indicated by the dashed line. Beyond the edge of the array there is little adherent myelin. The scale bar is 50 μm. (b) Microarray formed with neuronal lipid rafts showing > 99% occupancy. The scale bar is 50 μm. (c) Magnified image of a microarray formed with neuronal lipid rafts. The line scans for lines 1 – 5 can be seen in Supporting Information Figure S5c. The scale bar is 10 μm. (d) A bright field image of a microarray with 1 μm-diameter wells with 3 μm periodicity overlaid with a fluorescence image of FM-143-stained lipid rafts assembled into the wells. In this image there are 975 wells, all of contain fluorescent lipid rafts, therefore the occupancy for this image is 100% over the approximately 80 μm × 80 μm area. The scale bar is 30 μm. (e) Cortical neurons in culture stained with TRITC-conjugated CTX. The scale bar is 10 μm. (f) Neuronal lipid raft microarray rendered fluorescent by CTX binding to GM1. The scale bar is 15 μm. (g) The same array as in (f) showing the red fluorescence channel, which indicates that very little SAPE binds to the neuronal lipid raft microarray. The scale bar is 15 μm.
Figure 4
Figure 4
Multicomponent arrays formed by microfluidic delivery of myelin and neuronal raft membranes. (a) Fluorescence image after myelin and rafts were deposited via microfluidic channels on the microarray substrate. The left and right stripes contain myelin and the middle stripe contains neuronal raft membranes. The membranes are stained with FM1-43. The scale bar is 250 μm. (b) Fluorescence image of the same three stripes after applying the PDMS squeegee and incubating with IgMO4. The scale bar is 250 μm. (c–e) Magnified images from the three stripes showing that IgMO4 only binds to the myelin microarrays. (c) is from the left stripe, (d) is from the middle stripe and (e) is from the right stripe. The scale bars in (c–e) are 30 μm.
Figure 5
Figure 5
Phospholipid vesicle nanoarrays and SPR sensing. (a) SEM image of a nanoarray substrate viewed in cross section. The as-fabricated nanoarrays have wells with 200 nm diameter and 600 nm periodicity, but deposition of Al2O3 by ALD (light-colored layer on surface) shrinks the well diameter to approximately 80 nm. The scale bar is 1 μm. (b) Fluorescence image of a nanoarray formed with Rho-PE labeled egg PC vesicles showing high well occupancy and that nanoarray well contents can be optically resolved. The scale bar is 10 μm. (c) A SEM image of a nanowell array (32×32) milled into a gold film. The scale bar is 5 μm. (d) Magnified SEM image of a gold nanowell array. The wells are 200 nm in diameter and have 400 nm periodicity. The scale bar is 500 nm. (e) Representative transmission spectra for SPR sensing of IgMO4 binding to myelin particles in a gold nanowell array. The red curve is the negative control spectrum where SAPE does not bind to myelin, while the blue curve is the spectrum after IgMO4 binds to myelin. IgMO4 binding results in a small red-shift of the spectrum. (f) Comparison of mean spectral shifts after incubation with SAPE and IgMO4 showing a significant difference between the two cases. The error bars are standard error of the mean and * indicates a significant difference (P = 0.03) using a one-tailed Wilcoxon matched-pairs signed rank test.

References

    1. MacBeath G, Schreiber SL. Printing Proteins as Microarrays for High-throughput Function Determination. Science. 2000;289:1760–1763. - PubMed
    1. Kodadek T. Protein Microarrays: Prospects and Problems. Chem Biol. 2001;8:105–115. - PubMed
    1. Feizi T, Fazio F, Chai W, Wong C. Carbohydrate Microarrays - A New Set of Technologies at the Frontiers of glycomics. Curr Opin Struct Biol. 2003;13:637–645. - PubMed
    1. Ramachandran N, Hainsworth E, Bhullar B, Eisenstein S, Rosen B, Lau AY, Walter JC, LaBaer J. Self-assembling Protein Microarrays. Science. 2004;305:86–90. - PubMed
    1. Jones RB, Gordus A, Krall JA, MacBeath G. A Quantitative Protein Interaction Network for the ErbB Receptors Using Protein Microarrays. Nature. 2006;439:168–174. - PubMed

Publication types