. 2011 Aug 17;101(4):809-17.
doi: 10.1016/j.bpj.2011.06.010.

Computational electrophysiology: the molecular dynamics of ion channel permeation and selectivity in atomistic detail

Affiliations

Computational electrophysiology: the molecular dynamics of ion channel permeation and selectivity in atomistic detail

Carsten Kutzner et al. Biophys J. .

Abstract

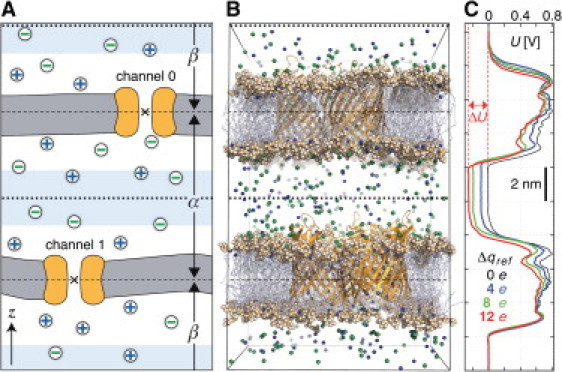
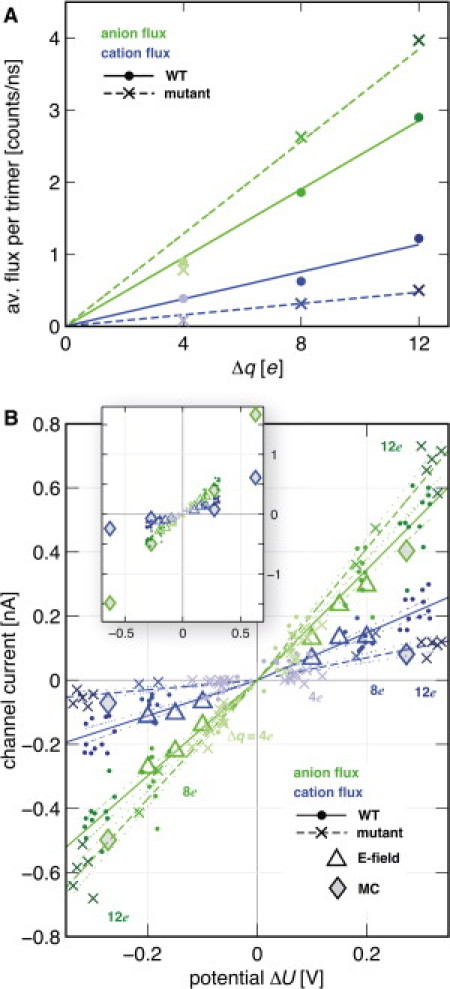
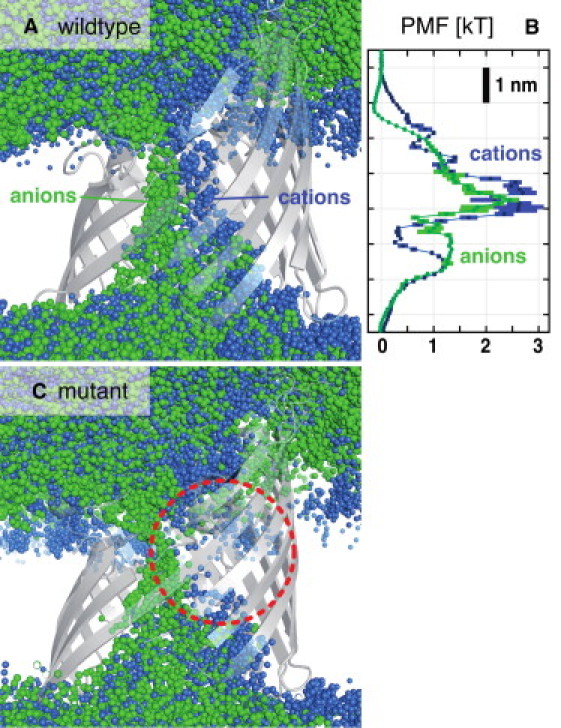
Presently, most simulations of ion channel function rely upon nonatomistic Brownian dynamics calculations, indirect interpretation of energy maps, or application of external electric fields. We present a computational method to directly simulate ion flux through membrane channels based on biologically realistic electrochemical gradients. In close analogy to single-channel electrophysiology, physiologically and experimentally relevant timescales are achieved. We apply our method to the bacterial channel PorB from pathogenic Neisseria meningitidis, which, during Neisserial infection, inserts into the mitochondrial membrane of target cells and elicits apoptosis by dissipating the membrane potential. We show that our method accurately predicts ion conductance and selectivity and elucidates ion conduction mechanisms in great detail. Handles for overcoming channel-related antibiotic resistance are identified.


Figures

Figure 1
Figure 1
(A) Sketch of the simulation system. (Gray) The two lipid bilayers. (Orange) Channels; (Green) Anions; (Blue) Cations. (Dashed lines) Boundaries between compartments α and β. (Dotted lines) Compartment midplanes around which the buffer volumes (light blue) are centered. (B) Snapshot of a simulation of wild-type PorB at 200 mM NaCl concentration at t = 22 ns. Water molecules are omitted for clarity. (C) Time average of the electrostatic potential U along the z axis (0–50 ns) for wild-type PorB at 1 M NaCl, arising from imbalances Δq between 0 and 12 elementary charges (color-coded). See Fig. 3 for the corresponding ionic currents.
Figure 2
Figure 2
Ion flux recorded in response to different charge imbalances comparing wild-type (WT) and G103K PorB mutant at Δq = 4 e, 8 e, and 12 e. Different shading indicates different Δq. For each setting two flux curves are recorded, one for each membrane polarization.
Figure 3
Figure 3
Ionic current is determined from the slopes of the flux curves shown in Fig. 2. (A) Net ion flux accumulated during the simulation for charge imbalances Δq/e = 4, 8, and 12. (B) Ionic current as a function of the potential difference determined for trajectory slices of length 20 ns.
Figure 4
Figure 4
(A) Overlay of ion positions from 500 snapshots of a 100-ns PorB simulation at a charge imbalance of Δq = 8 e. (B) Potential of mean force for Cl (green) and Na+ ions (blue) for wild-type PorB. (C) As A, but for PorB mutant G103K. The mutant shows a disrupted cation pathway (red circle).
Figure 5
Figure 5
Perturbation of the atomic forces caused by a single H2O/Cl exchange. Thin dots mark all interatomic forces in an unperturbed system at a representative time step. Thick dots display the absolute difference of the interatomic forces before and after the water/ion exchange. The atomic charge is color-coded. Dashed lines show c × r−2 with 10 ≤ c ≤ 1000.
Figure 6
Figure 6
Sustaining ionic current with the nonequilibrium switching MC protocol. (A) Ion counts in the compartments in response to an energy offset of W0 = 175 kJ/mol, starting from an equilibrated system at t = 0 ps with neutral compartments. (B) Charge imbalance Δq(t), resulting from W0 = 125 kJ/mol (red), and W0 = 175 kJ/mol (cyan). Accepted MC moves (marked by black stars) quickly build up a charge imbalance starting from Δq = 0 e at t = 0 ps. (C) Ionic currents for each channel recorded in response to the applied energy offset of W0 = 125 kJ/mol (thick lines), and W0 = 175 kJ/mol (thin lines).

Comment in

References

    1. Wulff H., Castle N.A., Pardo L.A. Voltage-gated potassium channels as therapeutic targets. Nat. Rev. Drug Discov. 2009;8:982–1001. - PMC - PubMed
    1. Kaczorowski G.J., McManus O.B., Garcia M.L. Ion channels as drug targets: the next GPCRs. J. Gen. Physiol. 2008;131:399–405. - PMC - PubMed
    1. Roux B., Allen T., Im W. Theoretical and computational models of biological ion channels. Q. Rev. Biophys. 2004;37:15–103. - PubMed
    1. Roux B. The membrane potential and its representation by a constant electric field in computer simulations. Biophys. J. 2008;95:4205–4216. - PMC - PubMed
    1. Jensen M.Ø., Borhani D.W., Shaw D.E. Principles of conduction and hydrophobic gating in K+ channels. Proc. Natl. Acad. Sci. USA. 2010;107:5833–5838. - PMC - PubMed

Publication types

LinkOut - more resources