. 2011 Aug 18;10(2):165-74.
doi: 10.1016/j.chom.2011.07.007.

RNA-Seq-based monitoring of infection-linked changes in Vibrio cholerae gene expression

Affiliations

RNA-Seq-based monitoring of infection-linked changes in Vibrio cholerae gene expression

Anjali Mandlik et al. Cell Host Microbe. .

Abstract

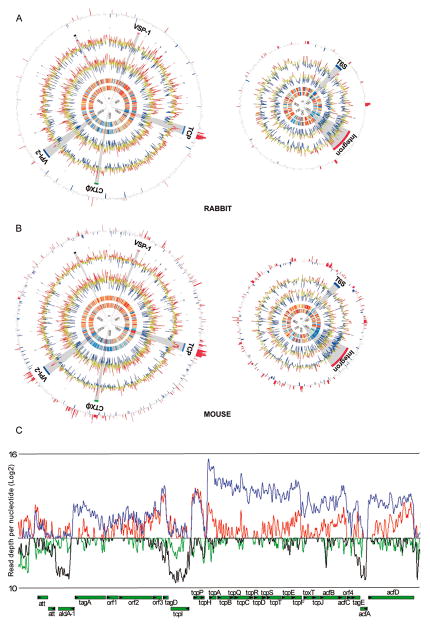
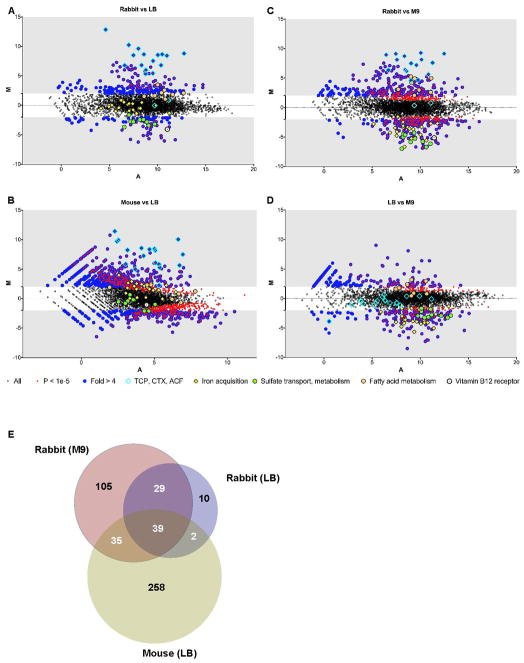
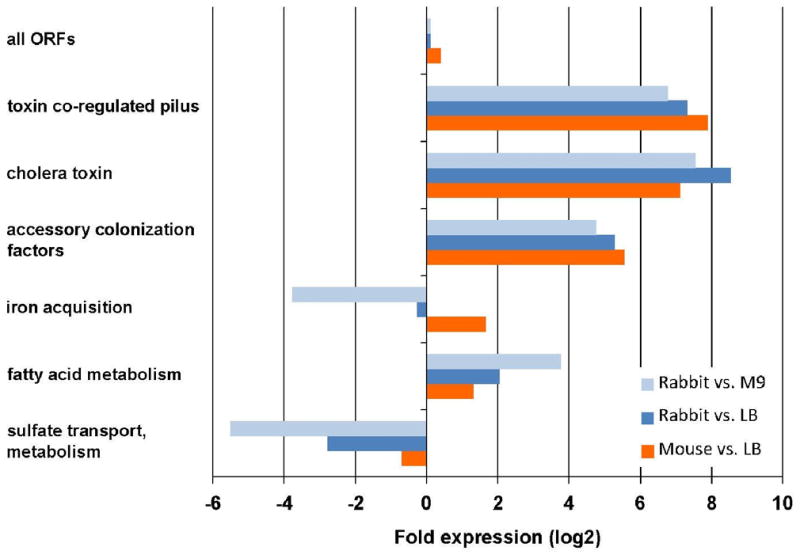
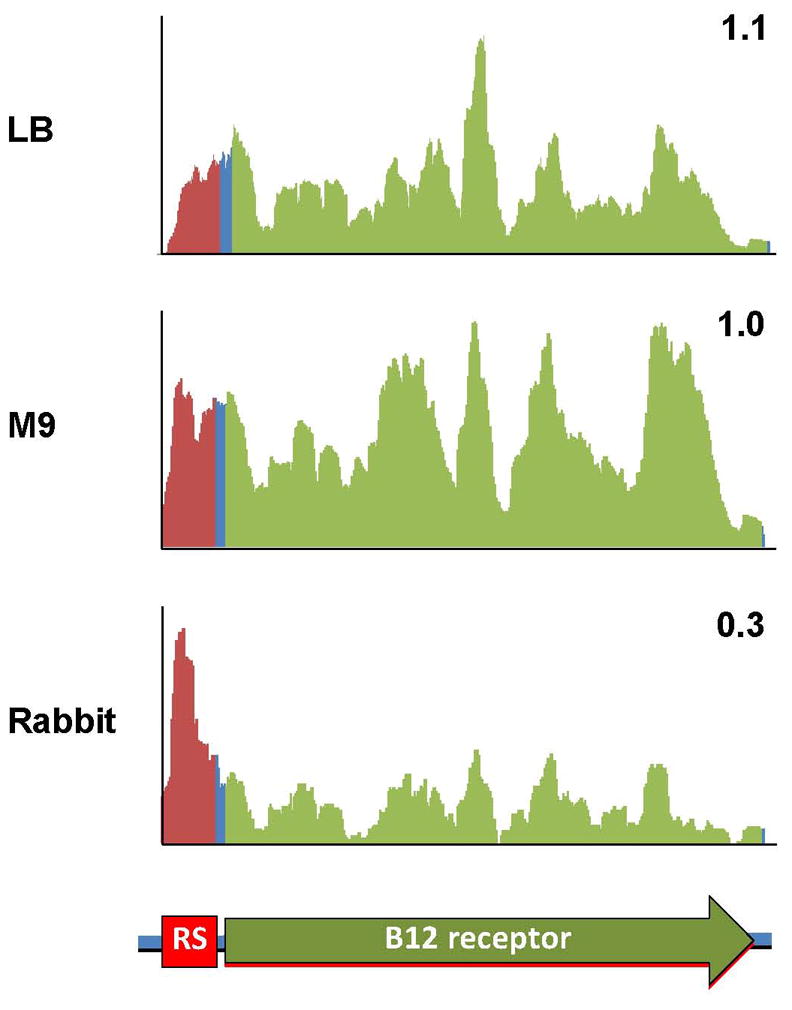
Pathogens adapt to the host environment by altering their patterns of gene expression. Microarray-based and genetic techniques used to characterize bacterial gene expression during infection are limited in their ability to comprehensively and simultaneously monitor genome-wide transcription. We used massively parallel cDNA sequencing (RNA-seq) techniques to quantitatively catalog the transcriptome of the cholera pathogen, Vibrio cholerae, derived from two animal models of infection. Transcripts elevated in infected rabbits and mice relative to laboratory media derive from the major known V. cholerae virulence factors and also from genes and small RNAs not previously linked to virulence. The RNA-seq data was coupled with metabolite analysis of cecal fluid from infected rabbits to yield insights into the host environment encountered by the pathogen and the mechanisms controlling pathogen gene expression. RNA-seq-based transcriptome analysis of pathogens during infection produces a robust, sensitive, and accessible data set for evaluation of regulatory responses driving pathogenesis.


Figures

Figure 1
Figure 1
A–B) Profiles of V. cholerae gene expression in culture and during infection (A: rabbit (Illumina); B: mouse (Helicos)). Plots for chromosome I are on the left and for chromosome II are on the right and are based on data from two biological replicates for each condition. From inside to outside, the 6 circles in each plot correspond to the following: 1–2) heatmap of ranked coverage in 5 kb windows in vitro and in vivo, respectively 3–4) log2 of RPKMO (reads per kilobasepair of gene per million reads aligning to annotated ORFs) for each gene in vitro and in vivo, respectively. In circles 1–4 red, yellow, and blue correspond to windows/genes with high, middle, and low expression, respectively. 5) Regions encoding ribosomal proteins (black) or corresponding to indicated genomic islands. 6) Log2 of fold abundance in vivo vs. in vitro. Genes whose fold expression is statistically significant and > 4 fold higher or lower in vivo are highlighted in red and blue, respectively; the height of the bars corresponds to log2 of the differential abundance in vivo vs LB. Plots were created using Circos (Krzywinski et al., 2009). C) Strand-specific coverage per nucleotide across the genes within the TCP island. Blue and black lines represent read coverage sequenced and mapped from a representative rabbit transcript library and red and green lines represent those from a representative Illumina LB library. Read depth is plotted on a log2 scale to provide better definition of genomic regions with very high and low coverage. TCP genes are labeled and separated according to strand orientation. (see also Figure S1).
Figure 2
Figure 2
A–D) MA plots of V. cholerae RNA-seq data. In these plots, each point represents an annotated ORF. The log2 of the ratio of abundances of each ORF between the indicated conditions (M) is plotted against the average log2 of abundance of that ORF in all conditions (A). For each plot, M and A values were based on data from two biological replicates from each growth condition or animal model. Genes that are significantly differentially expressed (based on DESeq analyses) as well as several groups of genes that are mentioned in the text are highlighted with different symbols (see legend below plots). E) Venn diagram of genes over-expressed in mice and rabbits. Genes were considered over-expressed if their differential abundance between in vivo and in vitro samples was > 4-fold and had a P value < 1×10⁻⁵. The 39 genes in the overlap between rabbits and mice include 10 of the 13 genes in the ToxT regulon (Bina et al., 2003). (see also Figure S2 and Tables S2, S3, S4 and S5).
Figure 3
Figure 3
Differential expression of functionally related groups of genes in vivo compared to in culture. Fold expression was calculated based on the average M values calculated by DEseq for each group of genes. The following genes were included in each group: TCP: VC0825-0837; CTX: VC1456-1457; ACF: VC0840-0841, VC0844-0845; iron: VC0200, VCA0227-0230, VCA0911-0915, VC2209-2211, VC0771-VC0777; fatty acid: VC1042, VC1740, VC2231, VCA0137, VCA0744, VCA0747-0749; sulfate: VC2558, VC0538-0541, VC2559-2560, VC0384-0386. (see also Figure S3)
Figure 4
Figure 4
Coverage plots of RNA-seq reads aligning to a putative cobalamin-regulated riboswitch and its downstream gene. Y-axis is linear and values are arbitrary units corresponding to reads/position. The numbers in the corner of each plot correspond to the ratio of the abundance of ORF reads (green) vs. riboswitch region reads (red).

References

    1. Almagro-Moreno S, Boyd EF. Sialic acid catabolism confers a competitive advantage to pathogenic Vibrio cholerae in the mouse intestine. Infect Immun. 2009;77:3807–3816. - PMC - PubMed
    1. Anders S, Huber W. Differential expression analysis for sequence count data. Genome Biol. 2010;11:R106. - PMC - PubMed
    1. Bina J, Zhu J, Dziejman M, Faruque S, Calderwood S, Mekalanos J. ToxR regulon of Vibrio cholerae and its expression in vibrios shed by cholera patients. Proc Natl Acad Sci U S A. 2003;100:2801–2806. - PMC - PubMed
    1. Chiang SL, Mekalanos JJ. Use of signature-tagged transposon mutagenesis to identify Vibrio cholerae genes critical for colonization. Mol Microbiol. 1998;27:797–805. - PubMed
    1. Chin CS, Sorenson J, Harris JB, Robins WP, Charles RC, Jean-Charles RR, Bullard J, Webster DR, Kasarskis A, Peluso P, et al. The origin of the Haitian cholera outbreak strain. N Engl J Med. 364:33–42. - PMC - PubMed

Publication types

LinkOut - more resources