Review
. 2011 Aug 15;589(Pt 16):3901-4.
doi: 10.1113/jphysiol.2011.215103.

Statistics, probability, significance, likelihood: words mean what we define them to mean

Affiliations
Review

Statistics, probability, significance, likelihood: words mean what we define them to mean

Gordon B Drummond et al. J Physiol. .
No abstract available


Figures

Figure 1
Figure 1
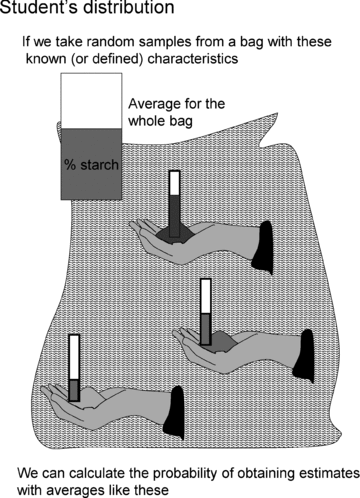
A population is randomly sampled and the sample is measured. Student's contribution was to characterize the probability distribution of obtaining samples with any particular estimate. This distribution took account of the uncertainty in the sample standard deviations. Frequently samples would have their mean close to the population mean. One would not often find a sample with a mean that was very different from the actual mean of the whole population.
Figure 2
Figure 2
A population of barley grains summarized as a frequency distribution histogram. The values for each grain are related to the average starch content, showing that some grains have more and some less than the average starch content. Placed around the population distribution we show the distributions obtained from random samples that have been taken from the population. Notice that these samples vary more, because the effects of random variation are more obvious when there are only small numbers in the sample.
Figure 3
Figure 3
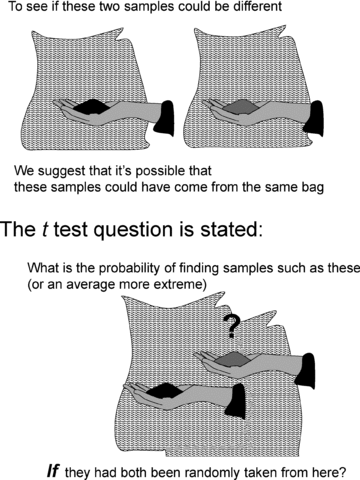
The reasoning behind the Student t test. We have two samples, randomly taken from two populations (different bags). To assess the possibility that the mean in each bag could be different, we hypothesize that these samples are in fact random samples from the SAME population (or more precisely that they are samples from populations with the same mean, which we have taken as having the same, but unknown, standard deviation): this is the null hypothesis.

References

    1. Ludbrook J, Dudley H. Why permutation tests are superior to t and F tests in biomedical research. Am Stat. 1998;52:127–132.
    1. Sheskin DJ. Handbook of Parametric and Nonparametric Statistical Procedures. 4th edn. Boca Raton: Chapman and Hall/CRC; 2007. p. 72.
    1. Student The probable error of a mean. Biometrika. 1908;6:1–25.