

Dramatic decline in the HIV-1 RNA level over calendar time in a large urban HIV practice
- PMID: 21844006
- PMCID: PMC3202317
- DOI: 10.1093/cid/cir467
Dramatic decline in the HIV-1 RNA level over calendar time in a large urban HIV practice
Abstract
Background: We have previously showed that as antiretroviral therapy has improved over time since 1995-1996, the likelihood of achieving virologic suppression has also improved. Antiretroviral therapy and antiretroviral therapy guidelines have continued to evolve, and we wished to determine the trend in human immunodeficiency virus (HIV-1) RNA levels over time in HIV-infected persons receiving care in our large urban HIV clinical practice in Baltimore, Maryland.
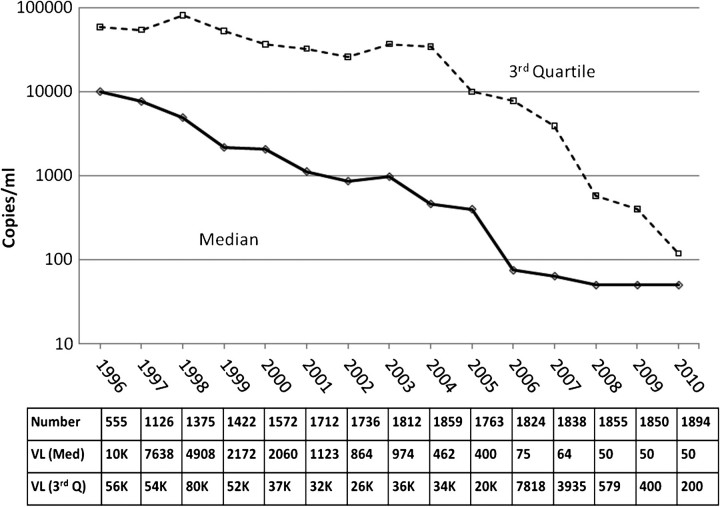
Methods: The HIV-1 RNA level was assessed each year from 1996 through 2010 at the date closest to 1 July for all patients in care and followed up in the Johns Hopkins HIV Clinical Cohort. The clinic population's median HIV-1 RNA level and stratified threshold levels were plotted. The demographic characteristics of the population were also assessed over time.
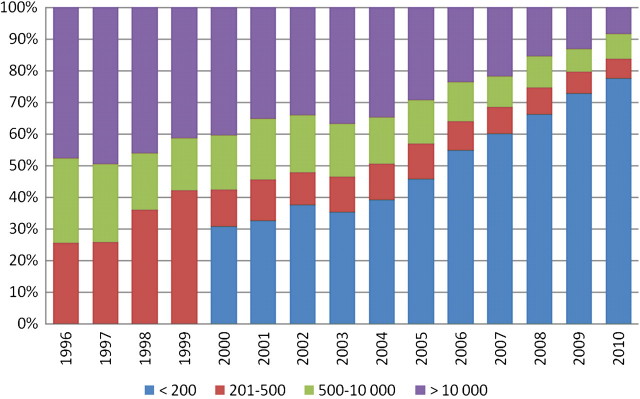
Results: From 1996 (shortly after highly active antiretroviral therapy [HAART] was introduced) to 2010, the median HIV-1 RNA level decreased from 10,400 to <200 copies/mL. The proportion of patients with an HIV-1 RNA level >500 copies/mL decreased from 75% to only 16% during this same period. The population itself became older, had a higher proportion of women, and a lower proportion of patients with injection drug use as a transmission risk, but it was geographically stable. There was an increase in HAART use over time.
Discussion: Our results demonstrate the remarkable impact of increased use of and improved management with HAART in this urban HIV-infected population.
Figures
Comment in
-
Antiretroviral therapy: now "it just works".Clin Infect Dis. 2011 Sep;53(6):605-8. doi: 10.1093/cid/cir470. Epub 2011 Aug 14. Clin Infect Dis. 2011. PMID: 21844007 No abstract available.
References
-
- Panel on Antiretroviral Guidelines for Adults and Adolescents. Guidelines for the use of antiretroviral agents in HIV-1-infected adults and adolescents. Department of Health and Human Services; 2011. Available at: http://www.aidsinfo.nih.gov/ContentFiles/AdultandAdolescentGL.pdf. Accessed 14 March 2011.
-
- Quinn TC, Wawer MJ, Sewankambo N, et al. Viral load and heterosexual transmission of human immunodeficiency virus type 1. Rakai Project Study Group. N Engl J Med. 2000;342:921–9. - PubMed
-
- Gray RH, Wawer MJ, Brookmeyer R, et al. Probability of HIV-1 transmission per coital act in monogamous, heterosexual, HIV-1-discordant couples in Rakai, Uganda. Lancet. 2001;357:1149–53. - PubMed
-
- Attia S, Egger M, Müller M, Zwahlen M, Low N. Sexual transmission of HIV according to viral load and antiretroviral therapy: systematic review and meta-analysis. AIDS. 2009;23:1397–404. - PubMed
-
- Lucas GM, Chaisson RE, Moore RD. Highly active antiretroviral therapy in a large urban clinic: risk factors for virological failure and adverse drug reactions. Ann Intern Med. 1999;131:81–7. - PubMed
Publication types
MeSH terms
Substances
Grants and funding
LinkOut - more resources
Full Text Sources
Medical
