

Global habitat suitability models of terrestrial mammals
- PMID: 21844042
- PMCID: PMC3140734
- DOI: 10.1098/rstb.2011.0113
Global habitat suitability models of terrestrial mammals
Abstract
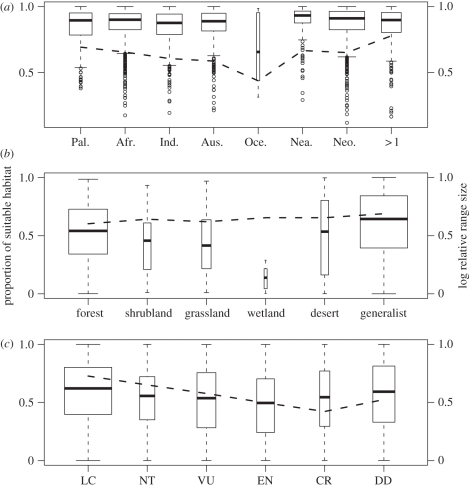
Detailed large-scale information on mammal distribution has often been lacking, hindering conservation efforts. We used the information from the 2009 IUCN Red List of Threatened Species as a baseline for developing habitat suitability models for 5027 out of 5330 known terrestrial mammal species, based on their habitat relationships. We focused on the following environmental variables: land cover, elevation and hydrological features. Models were developed at 300 m resolution and limited to within species' known geographical ranges. A subset of the models was validated using points of known species occurrence. We conducted a global, fine-scale analysis of patterns of species richness. The richness of mammal species estimated by the overlap of their suitable habitat is on average one-third less than that estimated by the overlap of their geographical ranges. The highest absolute difference is found in tropical and subtropical regions in South America, Africa and Southeast Asia that are not covered by dense forest. The proportion of suitable habitat within mammal geographical ranges correlates with the IUCN Red List category to which they have been assigned, decreasing monotonically from Least Concern to Endangered. These results demonstrate the importance of fine-resolution distribution data for the development of global conservation strategies for mammals.
Figures


References
-
- Gaston K. J. 1991. How large is a species geographic range? Oikos 61, 434–43810.2307/3545251 (doi:10.2307/3545251) - DOI - DOI
-
- Lamoreux J. F., Lacher T. E. 2010. Mammalian endemism, range size and conservation status in the southern temperate zone. Divers. Distrib. 16, 922–93110.1111/j.1472-4642.2010.00697.x (doi:10.1111/j.1472-4642.2010.00697.x) - DOI - DOI
-
- Kreft H., Jetz W. 2010. A framework for delineating biogeographical regions based on species distributions. J. Biogeogr. 37, 2029–205310.1111/j.1365-2699.2010.02375.x (doi:10.1111/j.1365-2699.2010.02375.x) - DOI - DOI
-
- Rodrigues A. S. L., et al. 2004. Effectiveness of the global protected area network in representing species diversity. Nature 428, 640–64310.1038/nature02422 (doi:10.1038/nature02422) - DOI - DOI - PubMed
-
- Ceballos G., Ehrlich P. R., Soberon J., Salazar I., Fay J. P. 2005. Global mammal conservation: what must we manage? Science 309, 603–60710.1126/science.1114015 (doi:10.1126/science.1114015) - DOI - DOI - PubMed
Publication types
MeSH terms
LinkOut - more resources
Full Text Sources