

Community structure and diversity of tropical forest mammals: data from a global camera trap network
- PMID: 21844049
- PMCID: PMC3140736
- DOI: 10.1098/rstb.2011.0115
Community structure and diversity of tropical forest mammals: data from a global camera trap network
Abstract
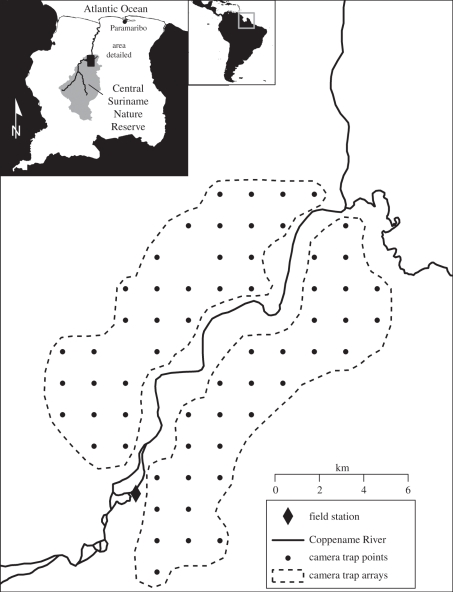
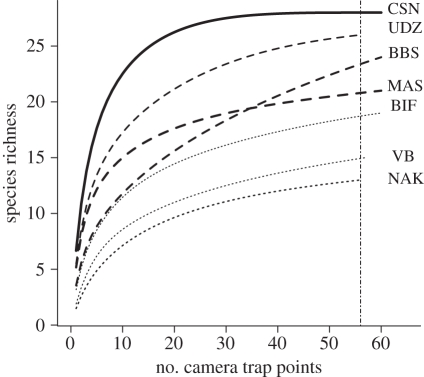
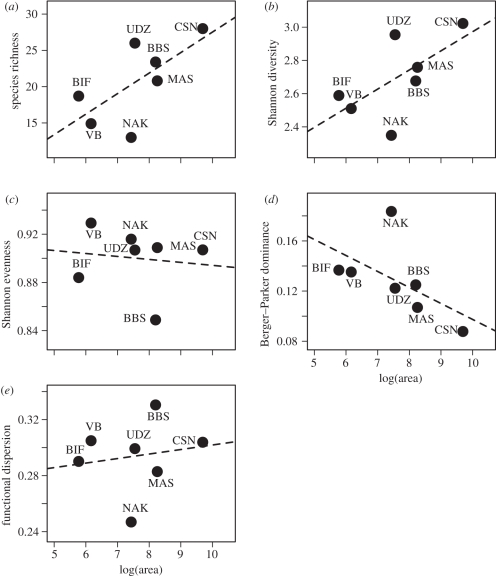
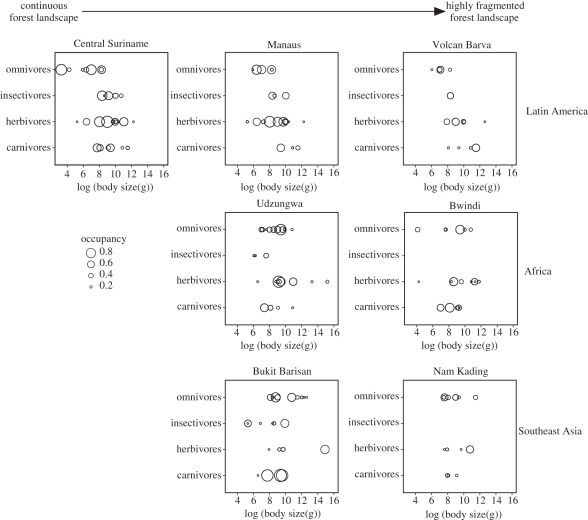
Terrestrial mammals are a key component of tropical forest communities as indicators of ecosystem health and providers of important ecosystem services. However, there is little quantitative information about how they change with local, regional and global threats. In this paper, the first standardized pantropical forest terrestrial mammal community study, we examine several aspects of terrestrial mammal species and community diversity (species richness, species diversity, evenness, dominance, functional diversity and community structure) at seven sites around the globe using a single standardized camera trapping methodology approach. The sites-located in Uganda, Tanzania, Indonesia, Lao PDR, Suriname, Brazil and Costa Rica-are surrounded by different landscape configurations, from continuous forests to highly fragmented forests. We obtained more than 51 000 images and detected 105 species of mammals with a total sampling effort of 12 687 camera trap days. We find that mammal communities from highly fragmented sites have lower species richness, species diversity, functional diversity and higher dominance when compared with sites in partially fragmented and continuous forest. We emphasize the importance of standardized camera trapping approaches for obtaining baselines for monitoring forest mammal communities so as to adequately understand the effect of global, regional and local threats and appropriately inform conservation actions.
Figures
References
-
- Ceballos G., Ehrlich P., Soberon J., Salazar I., Fay J. 2005. Global mammal conservation: what must we manage? Science 309, 603–607 10.1126/science.1114015 (doi:10.1126/science.1114015) - DOI - PubMed
-
- Ceballos G., Ehrlich P. R. 2006. Global mammal distributions, biodiversity hotspots, and conservation. Proc. Natl Acad. Sci. USA 103, 19 374–19 379 10.1073/pnas.0609334103 (doi:10.1073/pnas.0609334103) - DOI - PMC - PubMed
-
- Hoffmann M., et al. 2010. The impact of conservation on the status of the world's vertebrates. Science 330, 1503–1509 10.1126/science.1194442 (doi:10.1126/science.1194442) - DOI - PubMed
-
- Hoffmann M., Belant J. L., Chanson J. S., Cox N. A., Lamoreux J., Rodrigues A. S. L., Schipper J., Stuart S. N. 2011. The changing fates of the world's mammals. Phil. Trans. R. Soc. B 366, 2598–2610 10.1098/rstb.2011.0116 (10.1098/rstb.2011.0116) - DOI - PMC - PubMed
-
- Rondinini C., Rodrigues A. S. L., Boitani L. 2011. The key elements of a comprehensive global mammal conservation strategy. Phil. Trans. R. Soc. B 366, 2591–2597 10.1098/rstb.2011.0111 (doi:10.1098/rstb.2011.0111) - DOI - PMC - PubMed
Publication types
MeSH terms
LinkOut - more resources
Full Text Sources