. 2011 Oct 1;71(19):6153-64.
doi: 10.1158/0008-5472.CAN-11-0720. Epub 2011 Aug 15.

Proto-oncogene PBF/PTTG1IP regulates thyroid cell growth and represses radioiodide treatment

Affiliations

Proto-oncogene PBF/PTTG1IP regulates thyroid cell growth and represses radioiodide treatment

Martin L Read et al. Cancer Res. .

Abstract

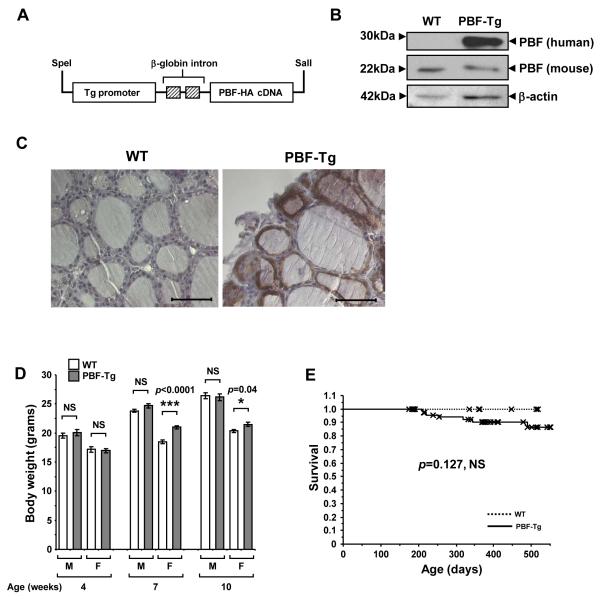
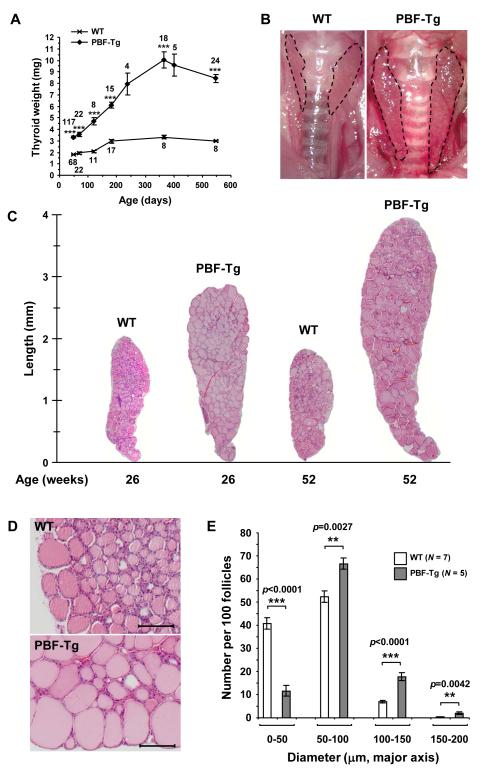
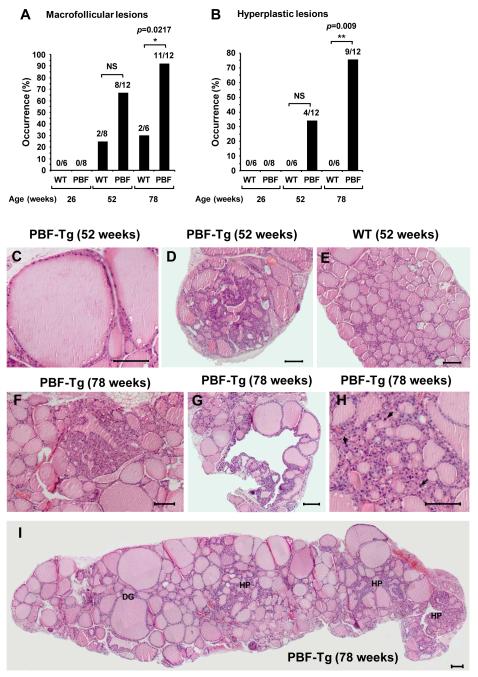
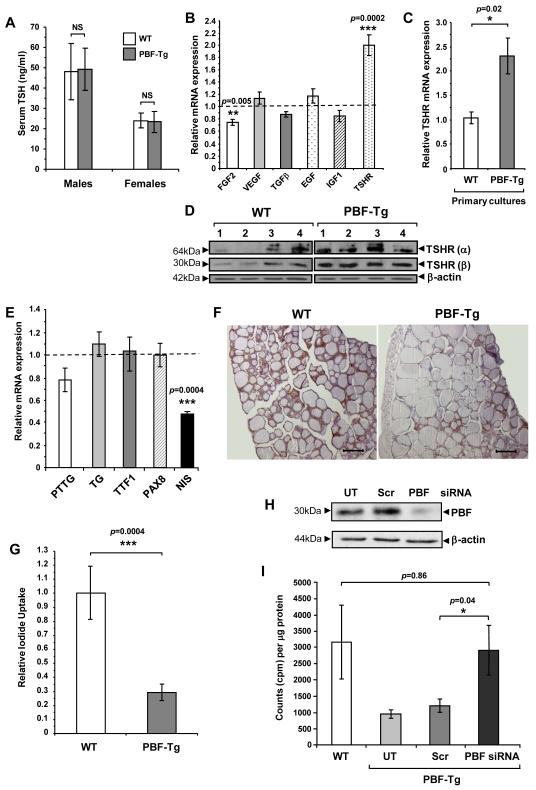
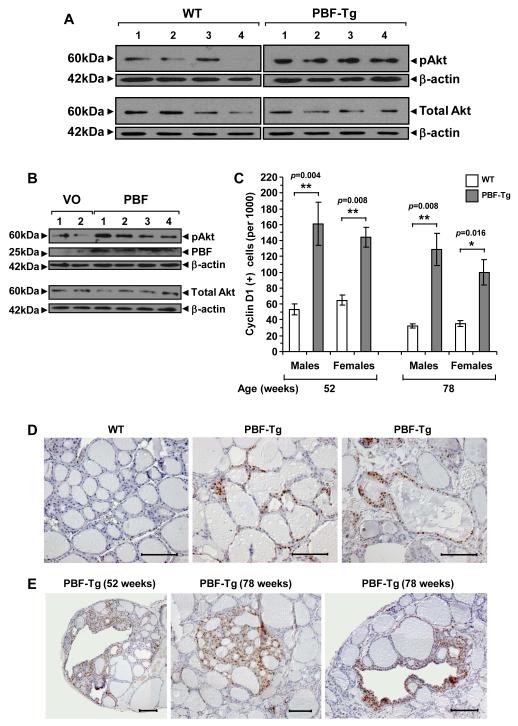
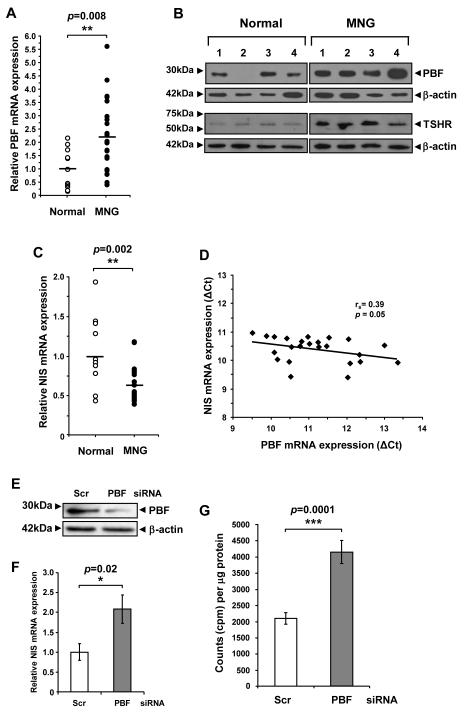
Pituitary tumor transforming gene (PTTG)-binding factor (PBF or PTTG1IP) is a little characterized proto-oncogene that has been implicated in the etiology of breast and thyroid tumors. In this study, we created a murine transgenic model to target PBF expression to the thyroid gland (PBF-Tg mice) and found that these mice exhibited normal thyroid function, but a striking enlargement of the thyroid gland associated with hyperplastic and macrofollicular lesions. Expression of the sodium iodide symporter (NIS), a gene essential to the radioiodine ablation of thyroid hyperplasia, neoplasia, and metastasis, was also potently inhibited in PBF-Tg mice. Critically, iodide uptake was repressed in primary thyroid cultures from PBF-Tg mice, which could be rescued by PBF depletion. PBF-Tg thyroids exhibited upregulation of Akt and the TSH receptor (TSHR), each known regulators of thyrocyte proliferation, along with upregulation of the downstream proliferative marker cyclin D1. We extended and confirmed findings from the mouse model by examining PBF expression in human multinodular goiters (MNG), a hyperproliferative thyroid disorder, where PBF and TSHR was strongly upregulated relative to normal thyroid tissue. Furthermore, we showed that depleting PBF in human primary thyrocytes was sufficient to increase radioiodine uptake. Together, our findings indicate that overexpression of PBF causes thyroid cell proliferation, macrofollicular lesions, and hyperplasia, as well as repression of the critical therapeutic route for radioiodide uptake.


Figures

Figure 1
Figure 1
Generation and characterisation of the PBF-Tg mouse model. A, Schematic of the bovine thyroglobulin (Tg)-PBF-HA transgene. B, Detection of transgenic PBF (human) and endogenous PBF (mouse) expression by Western blot analysis of PBF-Tg and WT thyroids. C, Detection of HA-tagged PBF (brown staining) by immunohistochemistry in PBF-Tg and WT thyroid sections. Scale bars: 50 μm. D, Body weight of male (M) and female (F) PBF-Tg and WT mice at 4, 7 and 10 weeks of age (N = 7-45). Data presented as mean ± SE. E, Kaplan-Meier survival curves for PBF-Tg (N = 82) and WT (N = 31) mice; P = 0.127.
Figure 2
Figure 2
Enlarged thyroid glands in PBF-Tg mice. A, Thyroid weight of PBF-Tg and WT mice. ***P < 0.0001 compared to age-matched WT mice. Mice numbers analysed are shown. B, Representative images of thyroid glands from 52-week old PBF-Tg and WT mice. Dotted line indicates margin of thyroid lobes. C, Representative images of H&E stained thyroid sections from PBF-Tg and WT mice at 26 and 52 weeks of age. D, Higher magnification of H&E stained sections of PBF-Tg and WT thyroids from 26 week old mice. Scale bars: 100 μm. E, Quantification of follicle diameter in PBF-Tg and WT thyroids from 26 week old mice expressed as frequency per 100 follicles measured. Data presented as mean ± SE.
Figure 3
Figure 3
Thyroid hyperplasia in PBF-Tg mice. Occurrence of macrofollicular (A) and hyperplastic lesions (B) in at least ten independent sectional planes per PBF-Tg or WT thyroid; N = 6-12 per genotype. Statistics analysed using Fisher’s exact test. C-E, Representative H&E stained images of a macrofollicular lesion (C) and nodular hyperplasia (D) in PBF-Tg thyroids, and of a WT thyroid (E) in 52 week old mice. F-G, Representative H&E stained images of hyperplasia in PBF-Tg thyroids in 78 week old mice. H, Arrows highlight enlarged nuclei in the hyperplastic lesion. I, Composite image of an entire thyroid lobe from a 78 week old PBF-Tg mouse with diffuse goitre (DG) and hyperplastic regions (HP). Scale bars: 100 μm.
Figure 4
Figure 4
Altered gene expression and iodide uptake in PBF-Tg thyroids. A, Serum TSH analyses in 6-week old PBF-Tg and WT mice; N = 6. Relative mRNA expression of indicated growth factor and TSHR in either PBF-Tg thyroids (B) or primary thyrocyte cultures (C) compared to WT; N = 6-15. D, Detection of TSHR isoforms α and β by Western blot analyses in PBF-Tg and WT thyroids; N = 4. E, Relative mRNA expression of PTTG, TG, TTF1, PAX8 and NIS in PBF-Tg thyroids compared to WT; N = 6-13. F, Detection of NIS by immunohistochemistry of PBF-Tg and WT thyroids. Scale bars: 100 μm. G, Relative 125I uptake in primary thyrocyte cultures from PBF-Tg and WT mice; N = 5-6. Detection of PBF-HA expression by Western blot analyses (H) and relative 125I uptake (I) in primary PBF-Tg thyrocyte cultures either non-transfected (UT) or transfected with PBF and scrambled (Scr) siRNA as indicated; N = 8-20. Data presented as mean ± SE
Figure 5
Figure 5
Cellular proliferation in PBF-Tg thyroids. A, Detection of pAkt and total Akt expression by Western blot analysis of PBF-Tg and WT thyroids. B, Detection of pAkt, total Akt and PBF by Western blot analysis of human thyrocytes transfected with either vector only (VO) or pcDNA3-PBF (PBF). C, Quantification of cyclin D1 immunostaining in sex- and age-matched PBF-Tg and WT thyroids, expressed as frequency of cyclin D1 positive cells per 1000 cells examined; N = 5062-12998 per thyroid. A total of 62,945 thyroid cells were examined for cyclin D1 expression in 17 PBF-Tg and 13 WT thyroids. Data presented as mean ± SE. Representative images of cyclin D1 staining in diffuse goitre regions (D) and hyperplastic lesions (E) of PBF-Tg and WT thyroids are shown. Scale bars: 100 μm.
Figure 6
Figure 6
Functional interaction between PBF and NIS in human thyrocytes. A, Quantification of PBF mRNA expression in MNG (N = 24) relative to normal thyroid (N = 11). Data presented as a scatterplot. B, Detection of PBF and TSHR expression by Western blot analyses in MNG and normal thyroids. C, Quantification of NIS mRNA expression in MNG (N = 24) relative to normal thyroid (N = 11). Data presented as a scatterplot. D, Correlation of PBF and NIS mRNA expression (shown as ΔCT values) in MNG and normal thyroid. Statistics analysed using Spearman rank correlation. E-G, Detection of PBF expression by Western blot analyses (E), quantification of NIS mRNA expression (F) and relative 125I uptake (G) in primary human thyrocyte cultures transfected with either PBF or Scr siRNA as indicated; N = 9-11. Data presented as mean ± SE.

References

    1. Boelaert K, Tannahill LA, Bulmer JN, Kachilele S, Chan SY, Kim D, et al. A potential role for PTTG/securin in the developing human fetal brain. Faseb J. 2003;17:1631–9. - PubMed
    1. Boelaert K, Smith VE, Stratford AL, Kogai T, Tannahill LA, Watkinson JC, et al. PTTG and PBF repress the human sodium iodide symporter. Oncogene. 2007;26:4344–56. - PubMed
    1. Chien W, Pei L. A novel binding factor facilitates nuclear translocation and transcriptional activation function of the pituitary tumor-transforming gene product. J Biol Chem. 2000;275:19422–7. - PubMed
    1. Mo Z, Zu X, Xie Z, Li W, Ning H, Jiang Y, et al. Antitumor effect of F-PBF(beta-TrCP)-induced targeted PTTG1 degradation in HeLa cells. J Biotechnol. 2009;139:6–11. - PubMed
    1. Reynolds LE, Watson AR, Baker M, Jones TA, D’Amico G, Robinson SD, et al. Tumour angiogenesis is reduced in the Tc1 mouse model of Down’s syndrome. Nature. 2010;465:813–7. - PMC - PubMed

Publication types

MeSH terms