. 2011 Oct 7;286(40):35071-8.
doi: 10.1074/jbc.M111.276089. Epub 2011 Aug 15.

c-Jun N-terminal kinase (JNK)-dependent acute liver injury from acetaminophen or tumor necrosis factor (TNF) requires mitochondrial Sab protein expression in mice

Affiliations

c-Jun N-terminal kinase (JNK)-dependent acute liver injury from acetaminophen or tumor necrosis factor (TNF) requires mitochondrial Sab protein expression in mice

Sanda Win et al. J Biol Chem. .

Abstract

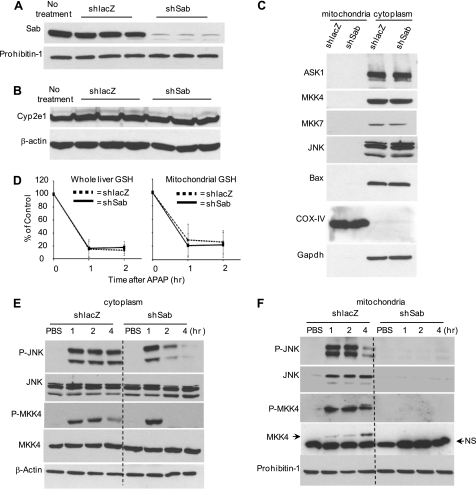
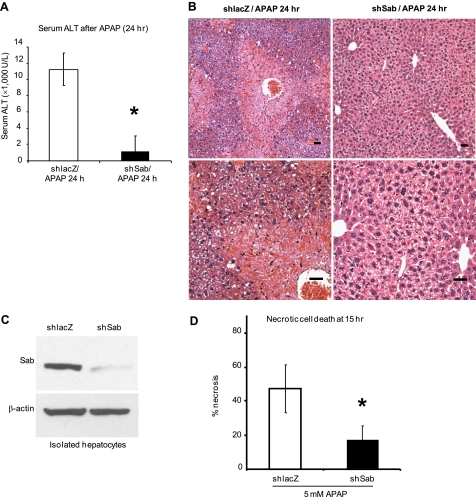
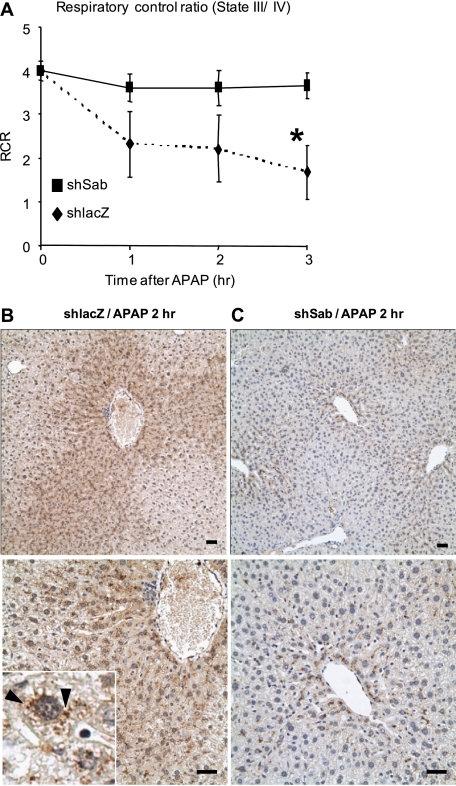
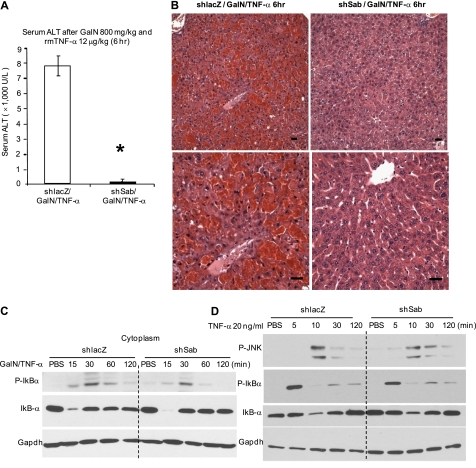
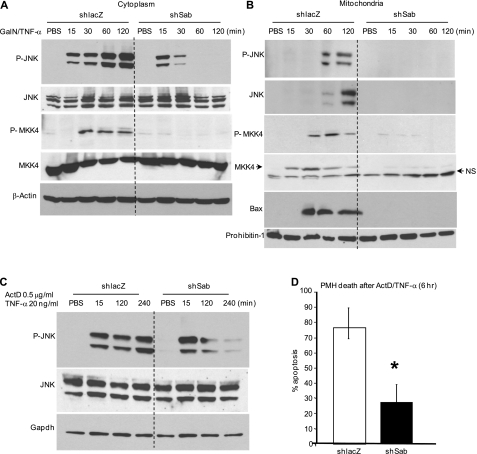
Sustained JNK activation plays a critical role in hepatotoxicity by acetaminophen or GalN/TNF-α. To address the importance of JNK translocation to mitochondria that accompanies sustained activation in these models, we assessed the importance of the expression of a potential initial target of JNK in the outer membrane of mitochondria, namely Sab (SH3 domain-binding protein that preferentially associates with Btk), also known as Sh3bp5 (SH3 domain-binding protein 5). Silencing the expression of Sab in the liver using adenoviral shRNA inhibited sustained JNK activation and mitochondrial targeting of JNK and the upstream MKK4 (MAPK kinase 4), accompanied by striking protection against liver injury in vivo and in cultured hepatocytes in both toxicity models. We conclude that mitochondrial Sab may serve as a platform for the MAPK pathway enzymes and that the interaction of stress-activated JNK with Sab is required for sustained JNK activation and toxicity.


Figures

FIGURE 1.
FIGURE 1.
Effect of silencing Sab on APAP-induced signaling activation in hepatotoxicity. A, immunoblot assessing efficiency of knockdown of Sab in mouse liver mitochondria. B, effect of adenoviral treatment on Cyp2e1 expression. Adenoviral shlacZ or adenoviral shsab was given intravenously as described under “Experimental Procedures,” and livers were removed after 7 days for immunoblotting. Each lane represents one mouse. C, effect of silencing Sab on basal expression of MAPK(s) and Bax. Mice were injected with adenoviral shlacZ or adenoviral shsab as described in under “Experimental Procedures.” Seven days after adenoviral injection, livers were taken, and the cytoplasm (post-mitochondrial fraction) was isolated by differential centrifugation. Western blot analysis was performed using antisera against ASK1, MKK4, MKK7, total JNK, and Bax. Cytochrome oxidase IV (COX-IV) and GAPDH were used as loading controls and subcellular markers. Data are representative of three experiments. D, GSH assay comparing the GSH levels of total liver homogenates or mitochondria after in vivo treatment with APAP (300 mg/kg) in warm PBS with or without Sab expression. The GSH assay is described under “Experimental Procedures.” Dashed line (♦), shlacZ-injected mice; solid line (■), shsab-injected mice (n = 3 or 4 per group). E and F, immunoblots assessing JNK and MKK4 activation in the cytoplasm (E) and translocation to mitochondria (F) after in vivo treatment with APAP (300 mg/kg) in warm PBS with or without Sab expression. NS, nonspecific band. All immunoblots are representative of three to five experiments.
FIGURE 2.
FIGURE 2.
Effect of silencing Sab on APAP-induced hepatotoxicity. A, serum ALT of shlacZ- or shsab-pretreated mice at 24 h following APAP treatment. Error bars represent S.D. *, p = 0.01 versus shlacZ group (Student's t test; n = 4 per group). B, representative histology of hematoxylin/eosin-stained liver tissue of mice from A. Scale bars = 100 μm. C and D, effect of decreased Sab expression on APAP-induced necrosis of PMHs isolated from adenoviral shlacZ- or adenoviral shsab-treated mice 7 days after adenoviral injection. C, Sab expression in isolated hepatocytes assessed by Western blotting. D, cultured hepatocytes from these mice were incubated with 5 mm APAP dissolved in warm medium. Fifteen hours after APAP addition, hepatocytes were stained with SYTOX Green, and necrotic cells were counted. *, p < 0.05 (n = three experiments).
FIGURE 3.
FIGURE 3.
Effect of silencing Sab on mitochondrial respiratory control ratio (state III/state IV) and nitrotyrosine formation in APAP-induced hepatotoxicity. A, respiratory control ratio (RCR) at various times after APAP treatment in shlacZ (dashed line (♦))- or shsab (solid line (■))-pretreated mice. Details are provided under “Experimental Procedures.” Error bars represent S.D. *, p = 0.002 versus shsab group (Student's t test; n = 3 or 5 per group). B and C, representative immunohistochemical staining of nitrotyrosine liver tissue from shlacZ (B)- and shsab (C)-pretreated mice after treatment with APAP (n = 3 per group). Scale bars = 100 μm. The inset shows punctate nitrotyrosine staining (arrowhead) after APAP treatment in shlacZ-pretreated mice.
FIGURE 4.
FIGURE 4.
Effect of decreased Sab expression on GalN/TNF-α-induced hepatotoxicity in vivo and initial TNF receptor signaling in vivo and in PMHs. A, serum ALT of shlacZ- or shsab-pretreated mice at 6 h following TNF-α treatment. Error bars represent S.D. rmTNF-α, recombinant mouse TNF-α. *, p = 0.008 versus shlacZ group (Student's t test; n = 4 per group). B, representative histology of hematoxylin/eosin staining of mouse liver tissue. Scale bars = 100 μm. C and D, effect of Sab knockdown on upstream TNF receptor signaling in vivo and in PMHs. Mice were injected with adenoviral shlacZ or adenoviral shsab as described under “Experimental Procedures.” C, 7 days after adenoviral injection, mice were injected with GalN/TNF-α intraperitoneally, and livers were removed and fractionated. Immunoblotting of liver cytoplasm was performed at the indicated times after GalN/TNF-α treatment in vivo. D, hepatocytes from adenovirus-treated mice were cultured and incubated with TNF-α alone for the indicated times. Immunoblotting of PMH extracts was performed using antisera against p-JNK, p-IκBα, IκBα, and GAPDH (loading control). Data are representative of three experiments.
FIGURE 5.
FIGURE 5.
Effect of decreased Sab expression on TNF-α-induced signaling activation in hepatotoxicity. A and B, immunoblots assessing JNK and MKK4 activation in the cytoplasm (A) and translocation to mitochondria (B) after in vivo treatment with GalN/TNF-α with or without Sab expression. NS, nonspecific band. Results are representative of three to five experiments. C, effect of decreased Sab expression on ActD/TNF-α-induced JNK activation of PMHs. Seven days after adenoviral injection, hepatocytes were isolated. Cultured hepatocytes from these mice were incubated with PBS or ActD/TNF-α, and whole cell extracts were examined by Western blotting for p-JNK and JNK at the indicated times. GAPDH was used as a loading control. D, PMHs from shlacZ- or shsab-pretreated mice were incubated with ActD/TNF-α for 6 h, and hepatocytes were stained with Hoechst 3325. Apoptotic cells (shrunken/fragmented nuclei) were counted as described under “Experimental Procedures.” *, p < 0.05 versus shlacZ group (n = three experiments).

References

    1. Johnson G. L., Nakamura K. (2007) Biochim. Biophys. Acta 1773, 1341–1348 - PMC - PubMed
    1. Czaja M. J. (2007) Semin. Liver Dis. 27, 378–389 - PubMed
    1. Han D., Ybanez M. D., Ahmadi S., Yeh K., Kaplowitz N. (2009) Antioxid. Redox Signal. 11, 2245–2263 - PMC - PubMed
    1. Weston C. R., Davis R. J. (2007) Curr. Opin. Cell Biol. 19, 142–149 - PubMed
    1. Liu H., Lo C. R., Czaja M. J. (2002) Hepatology 35, 772–778 - PubMed

Publication types

MeSH terms