. 2011 Aug 22;194(4):613-29.
doi: 10.1083/jcb.201011119. Epub 2011 Aug 15.

Actomyosin II contractility expels von Willebrand factor from Weibel-Palade bodies during exocytosis

Affiliations

Actomyosin II contractility expels von Willebrand factor from Weibel-Palade bodies during exocytosis

Thomas D Nightingale et al. J Cell Biol. .

Abstract

The study of actin in regulated exocytosis has a long history with many different results in numerous systems. A major limitation on identifying precise mechanisms has been the paucity of experimental systems in which actin function has been directly assessed alongside granule content release at distinct steps of exocytosis of a single secretory organelle with sufficient spatiotemporal resolution. Using dual-color confocal microscopy and correlative electron microscopy in human endothelial cells, we visually distinguished two sequential steps of secretagogue-stimulated exocytosis: fusion of individual secretory granules (Weibel-Palade bodies [WPBs]) and subsequent expulsion of von Willebrand factor (VWF) content. Based on our observations, we conclude that for fusion, WPBs are released from cellular sites of actin anchorage. However, once fused, a dynamic ring of actin filaments and myosin II forms around the granule, and actomyosin II contractility squeezes VWF content out into the extracellular environment. This study therefore demonstrates how discrete actin cytoskeleton functions within a single cellular system explain actin filament-based prevention and promotion of specific exocytic steps during regulated secretion.


Figures
Figure 1.
Figure 1.
Spinning-disk confocal microscope assay for monitoring fusion of—and VWF release from—individual WPBs in live cells. (A–E) HUVECs were nucleofected with the mCherry–P-selectinLum domain and GFP-VWF and imaged with a spinning-disk confocal microscope system in the absence (A) or presence (B–E) of 100 ng/ml PMA. Time on the panels indicates total time in media (A), media with PMA (B), or relative to fusion (0 s; C–E). Z stacks were acquired at a spacing of 0.5 µm every 5 s for 10 min, and images shown represent maximum intensity projections. (A, unstimulated) mCherry–P-selectinLum (Psel.lum.mcherry) and GFP-VWF are colocalized in WPBs, and there is a similar number of WPBs 605 s later. Individual WPBs move within the cytoplasm over time. Smaller images show individual channels of the 5-s merged image. (B, PMA stimulated) mCherry–P-selectinLum and GFP-VWF remain colocalized within WPBs by 5 s of PMA stimulation. Smaller images show individual channels of the 5-s merged image. By 605 s, many WPBs have exocytosed (asterisks indicate WPBs that fully exocytose during the time course of imaging). (C) Quantification of the intensity of fluorescence of mCherry–P-selectinLum and GFP-VWF for the individual organelle shown in D. Note that decrease in mCherry–P-selectinLum fluorescence (−5 to 0 s) occurs before the decrease in GFP-VWF fluorescence (−5 to 25 s) in the same WPB. (D) Still images of a video of exocytosis of the WPB in the box in B. The WPB becomes rounded in shape (compare GFP-VWF at −5 and 0 s), and this is linked to loss of mCherry fluorescence intensity (compare −5 and 0 s). (E) Quantification of the interval between formation of a rounded GFP-VWF shape and loss of mCherry fluorescence intensity for the population of exocytosing WPBs at 5-s time resolution (plotted from 51 events in five cells). (F) Schematic of exocytosis of full-length P-selectin and the P-selectin luminal domain. Bars: (A and B) 10 µm; (D) 4 µm.
Figure 2.
Figure 2.
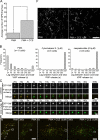
Effect of CCE on WPB exocytosis. (A, B, D, and E) HUVECs coexpressing GFP-VWF and the mCherry–P-selectinLum domain were stimulated with 100 ng/ml PMA for 10 min with or without a 15-min preincubation with 1 µM CCE (A, B, D, and E) or 0.5 µM jasplakinolide (B). Individual WPB fusion events (marked by loss of mCherry–P-selectinLum [P-sel.lum.mcherry] fluorescence) and release of its GFP-VWF contents (marked by loss of GFP fluorescence into the medium) in live cells were assayed as described in Fig. 1. To compare individual WPBs, fusion is assigned to 0 s (see Results for explanation). (A) Mean number of individual WPB fusion events in 300 s (n = 11 cells for each condition). Note a more than threefold increase in fusion events in CCE-treated, PMA-stimulated cells. **, P = 0.004; t test. Error bars show SDs. (B) Duration of release of VWF measured as the lag between WPB fusion and full release of GFP-VWF for individual WPBs in live PMA-stimulated cells (83 fusion events in 11 cells) or in PMA-stimulated cells treated with CCE (107 fusion events in five cells) or jasplakinolide (66 fusion events from six cells). 300+ s indicates that VWF failed to release during 600 s of time-lapse filming. (C, control) Still images from a video of individual WPB fusion and release of VWF in live cells. (D, CCE treated) Note that in CCE-treated cells, WPB fusion occurs (0 s), yet GFP-VWF fails to release even after 470 s after fusion. (E) Whole-cell view of untreated or CCE-treated, PMA-stimulated live cells. Asterisks indicate WPBs that fully exocytose during 300 s of imaging. The boxed regions are the regions shown at higher magnification in C and D at a number of time points. Images shown (C–E) represent maximum intensity projections of z stacks. (F) Cells were fixed and labeled for released VWF. Note that markedly less VWF strings are apparent in CCE-treated compared with untreated, PMA-stimulated cells. The arrows denote the presence of the strings of VWF. Bars: (C and D) 2 µm; (E) 10 µm; (F) 100 µm.
Figure 3.
Figure 3.
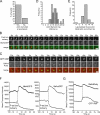
Actin is recruited to WPBs during exocytosis. (A–G) HUVECs coexpressing either Lifeact-GFP, a marker for actin filaments, and the mCherry–P-selectinLum (P.sel.lum.mcherry) domain (A, B, and D–F) or Lifeact-Ruby and GFP-VWF (C and G) stimulated with 100 ng/ml PMA and imaged live with a spinning-disk confocal microscope. Z stacks at a spacing of 0.5 µm were acquired every 2 s (A, B, and D–F) or 5 s (C and G) for 5 min, and images are all maximum intensity projections, except Lifeact channels in B and C, which are a single 0.5-µm-deep slices (see Materials and methods for a further explanation). Fusion is identified either by loss of mCherry fluorescence (A, D, and E) or by formation of rounded WPB structures (B, C, F, and G; assigned to 0 s in D–G). (A) Quantification of WPB fusion events in which Lifeact-GFP was recruited (plotted as the percentage of 143 total fusion events in nine cells). (B) Still images from a video that probes an individual WPB fusion event. The asterisk denotes a WPB that does not exocytose in the time course shown. (C) Still images from a video that probes an individual WPB fusion event and release of GFP-VWF contents. (D) Lifeact-GFP lifetime on individual WPBs (total of 43 WPBs in five cells). Actin filament ring total lifetime is defined as total time to reach peak fluorescence intensity and subsequent decay of signal. (E) Lag between WPB fusion and recruitment of Lifeact-GFP (total of 43 WPB fusion events in five cells). Initial actin recruitment is defined as the frame relative to fusion in which Lifeact fluorescence is first identified associated with the exocytosing WPB. (F) Change in mean fluorescence intensity of mCherry–P-selectinLum and Lifeact-GFP with the times of two WPB fusion events (the granule shown in B is plotted on the left trace). (G) For the WPB shown in C, change in mean fluorescence intensity with time of GFP-VWF and Lifeact-Ruby of the fusion and release of VWF content events. The dotted lines show the time points of WPB fusion. Bars, 2 µm.
Figure 4.
Figure 4.
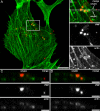
Actin filaments are associated with one end of an individual WPB. (A) Untransfected HUVECs were stimulated for 5 min with 100 ng/ml PMA and then fixed in formaldehyde with a procedure optimal for the actin cytoskeleton (see Materials and methods), costained for VWF (red) and phalloidin (green), and imaged on a confocal microscope. Images shown are maximum intensity projections. (B) Box region in A is shown at a higher magnification and illustrates WPB fusion events associated with actin filament rings. Dotted lines represent regions in which xzy sections were taken. (C and D) Xzy sections of the zoomed in region showing position of actin filaments relative to VWF. Bars: (A) 10 µm; (C and D) 2 µm.
Figure 5.
Figure 5.
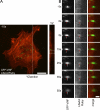
Fused WPBs translocate out of the plane of the plasma membrane during WPB release of contents. (A) Still from an xyz-projected view of WPB exocytosis. Inset shows the region in which the vertical (yz projection) was made in B. Time is relative to fusion (0 s). The dotted line shows the part of the cell in which a yz section was generated. The boxed region is shown at higher magnification and at a number of time points in B. Bar, 10 µm. (B) Time series of the organelle in the box in A as viewed in a vertical section. The short red arrows (0–55 s; GFP-VWF and Lifeact-Ruby time strips) indicate the position of the center of maximum fluorescence intensity within the WPBs or associated actin filaments at the point of fusion (0 s), and the long white arrows show the center at each new position (5–55 s). The WPB appears to translocate to the right. Actin filaments associated with WPBs appear to remain stationary with respect to the substratum. VWF and Lifeact-Ruby are single image planes. Bar, 1 µm.
Figure 6.
Figure 6.
Myosin II activity is required for the release of VWF contents. (A) Untransfected HUVECs were stimulated for 5 min with 100 ng/ml PMA and then fixed in formaldehyde with a procedure optimal for imaging the actin cytoskeleton and myosin II (see Materials and methods), costained for pan–myosin II (panMyoII; blue), VWF (red), and actin (green), and imaged on a confocal microscope. The magnified insets on the right show an exocytosing WPB with an actin ring and a WPB in a similar part of the cell yet to exocytose with no actin ring. Images shown are maximum intensity projections. The arrows highlight the recruitment of actin and myosin to the exocytosing VWF in the first three images. But in a situation in which VWF is not released (the next three images), actin and myosin are not recruited. Bar, 10 µm. (B) Western blot analysis of myosin II isotypes in HUVECs. (C) HUVECs expressing the mCherry–P-selectinLum domain were stimulated with 100 ng/ml PMA for 10 min with or without a 5-min preincubation with 25 µM blebbistatin. Mean number of individual WPB fusion events in 300 s (control: n = 11 cells; blebbistatin: n = 6 cells; **, P = 0.004; ns, P = 0.863; t test). Error bars show SDs. (D) Quantification of VWF secretion at different blebbistatin concentrations. Error bars represent SDs. (E–H) HUVECs coexpressing VWF-GFP and Lifeact-Ruby were imaged before treatment with blebbistatin, preincubated with 25 µM blebbistatin for 2 min, and then stimulated with 100 ng/ml PMA for 10 min (in the continued presence of blebbistatin). During blebbistatin treatment, time-lapse images were only acquired from the Lifeact-Ruby (i.e., no blue light was present). A final image was then acquired from both markers. (E) Still images from a video of individual WPB fusion and blebbistatin-inhibited release of VWF in live cells. Bar, 2 µm. (F) Actin filament ring total lifetime, defined as total time to reach peak fluorescence intensity and subsequent decay of signal, in blebbistatin-treated cells (plotted from 39 actin-positive fusion events in six cells). (G) Quantification of intensity of fluorescence of Lifeact-Ruby for the individual organelle shown in E. The dotted line shows the time point of WPB fusion. (H) Quantification of WPB fusion events in which Lifeact-Ruby was recruited (plotted as the percentage of 82 total fusion events in six cells) to WPBs in the presence of blebbistatin. Note that blocking myosin II has no effect on the fusion of WPBs yet blocks subsequent secretion of VWF from the same fused organelle and extends the lifetime of the actin filament ring. In all parts of this figure, blebbistatin treatment of cells was performed in the absence of any blue light, except for the final image in E (labeled post).
Figure 7.
Figure 7.
Myosin light chain kinase activity is required for the release of VWF contents. (A–G) HUVECs coexpressing GFP-VWF and the mCherry–P-selectinLum domain were stimulated with 100 ng/ml PMA for 10 min with or without a 15-min preincubation with 50 µM ML-7 (A and C–G) or treated with Y27632 (B). Fusion is assigned to 0 s. (A) Quantification of VWF secretion at different ML-7 concentrations. (B) Quantification of VWF secretion at different Y27632 concentrations. (C) Lag between WPB fusion and full release of GFP-VWF for individual WPBs in live PMA-stimulated cells in the presence (137 fusion events in nine cells) or absence (83 fusion events in 11 cells) of ML-7. 300+ s indicates that VWF failed to release during 600 s of time-lapse filming. (D) Still images from a video of an individual WPB fusion event in ML-7–inhibited cells cotransfected with mCherry–P-selectinLum (P.sel.lum.mcherry) and Lifeact-GFP. Bar, 2 µm. (E) Actin filament ring total lifetime, defined as total time to reach peak fluorescence intensity and subsequent decay of signal, in ML-7–treated cells (plotted from 63 actin positive fusion events from six cells). (F) Quantification of intensity of fluorescence of mCherry–P-selectinLum and Lifeact-GFP for the individual organelle shown in D. The dotted line shows the time point of WPB fusion. (G) Quantification of WPB fusion events in which Lifeact-GFP was recruited (plotted as the percentage of 142 total fusion events in six cells) to WPBs in the presence of ML-7. Error bars represent SDs.
Figure 8.
Figure 8.
Ultrastructural analysis of WPBs during exocytosis. (A–D) HUVECs were stimulated with 100 ng/ml PMA for 10 min (A and C) or pretreated with 1 µM CCE for 15 min before PMA stimulation (B and D) and then labeled for released VWF (15-nm gold [A and B] or 15-nm gold and Alexa Fluor 488 nm [C and D]). (A) Scanning EM of PMA-stimulated HUVECs shows a network of VWF strings (i) and marked membrane ruffling (ii and iii) that appear to be sites of WPB exocytosis and initial VWF string release. These strings and sites are extensively labeled with anti-VWF/gold (see Fig. S1 for backscatter images showing VWF gold labeling). (B, i) CCE-treated cells show a marked absence of VWF strings. Instead, only small patches of intense gold labeling are present with no membrane ruffling, indicating the WPBs have fused but failed to release VWF as strings. (ii and iii) Magnified regions of the areas described by the white boxes. (C and D, i) Differential interference contrast images overlayed with a fluorescent image of VWF labeling (green). A specific exocytic site is magnified in the white boxed region. (C and D, ii–v) Serial TEM sections of the exocytic site shown in C and D (i) with v being the highest section. (C and D, vi) 3D reconstruction of the serial sections shown above. The reconstructions are also shown as Videos 6 and 7, revealing the same exocytic structures from a variety of angles. For the reconstruction, the VWF is highlighted in green, whereas the remainder of the cell is purple. Note that the VWF is released normally in the untreated cell, whereas the VWF in the drug-treated cell appears to be incompletely exocytosed. Fluorescent images are maximum intensity projections. All the serial TEM sections are shown in Fig. S2. Bars: (A and B, i–iii) 1 µm; (C and D, i) 10 µm; (C and D, ii–v) 200 nm.

References

    1. Andzelm M.M., Chen X., Krzewski K., Orange J.S., Strominger J.L. 2007. Myosin IIA is required for cytolytic granule exocytosis in human NK cells. J. Exp. Med. 204:2285–2291 10.1084/jem.20071143 - DOI - PMC - PubMed
    1. Babich V., Meli A., Knipe L., Dempster J.E., Skehel P., Hannah M.J., Carter T. 2008. Selective release of molecules from Weibel-Palade bodies during a lingering kiss. Blood. 111:5282–5290 10.1182/blood-2007-09-113746 - DOI - PubMed
    1. Berberian K., Torres A.J., Fang Q., Kisler K., Lindau M. 2009. F-actin and myosin II accelerate catecholamine release from chromaffin granules. J. Neurosci. 29:863–870 10.1523/JNEUROSCI.2818-08.2009 - DOI - PMC - PubMed
    1. Bhat P., Thorn P. 2009. Myosin 2 maintains an open exocytic fusion pore in secretory epithelial cells. Mol. Biol. Cell. 20:1795–1803 10.1091/mbc.E08-10-1048 - DOI - PMC - PubMed
    1. Bittins C.M., Eichler T.W., Gerdes H.H. 2009. Expression of the dominant-negative tail of myosin Va enhances exocytosis of large dense core vesicles in neurons. Cell. Mol. Neurobiol. 29:597–608 10.1007/s10571-009-9352-z - DOI - PMC - PubMed

Publication types

MeSH terms