. 2011 Oct;31(20):4205-18.
doi: 10.1128/MCB.05893-11. Epub 2011 Aug 15.

Reducing plasma membrane sphingomyelin increases insulin sensitivity

Affiliations

Reducing plasma membrane sphingomyelin increases insulin sensitivity

Zhiqiang Li et al. Mol Cell Biol. 2011 Oct.

Abstract

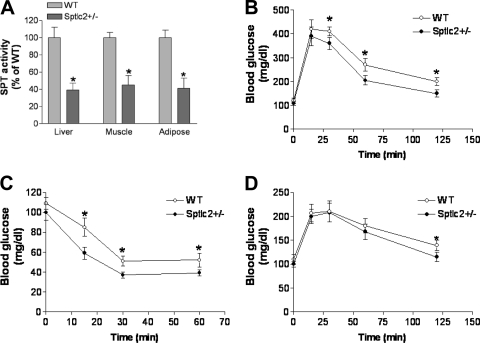
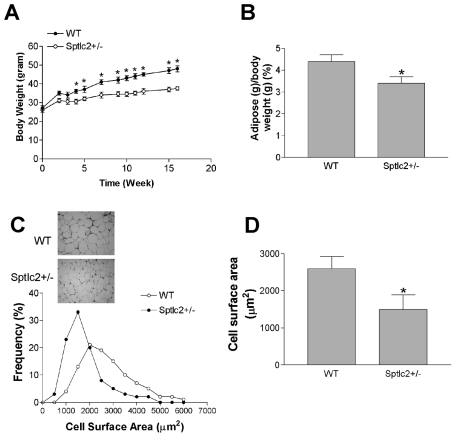
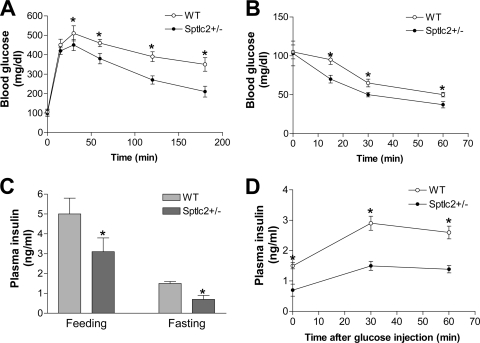
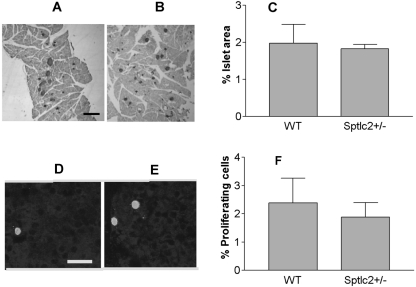
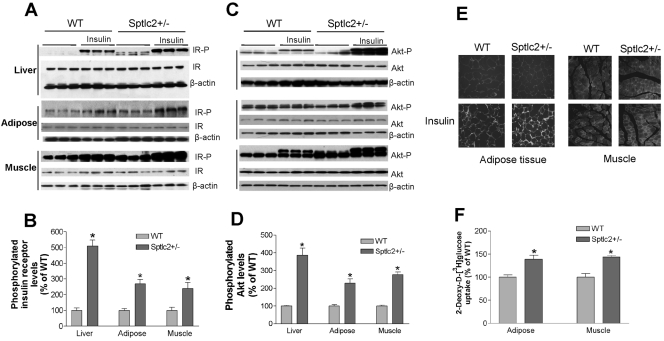
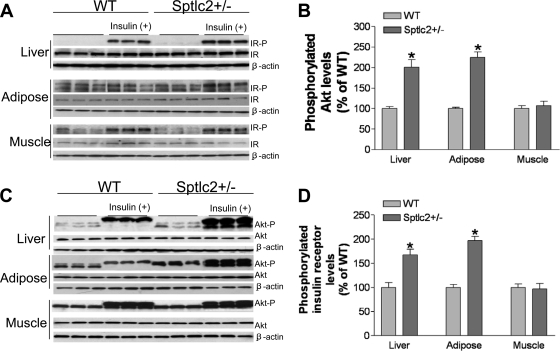
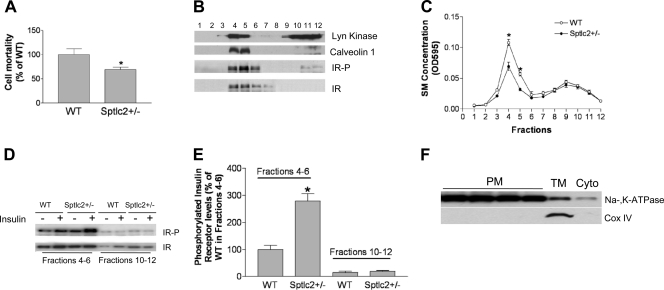
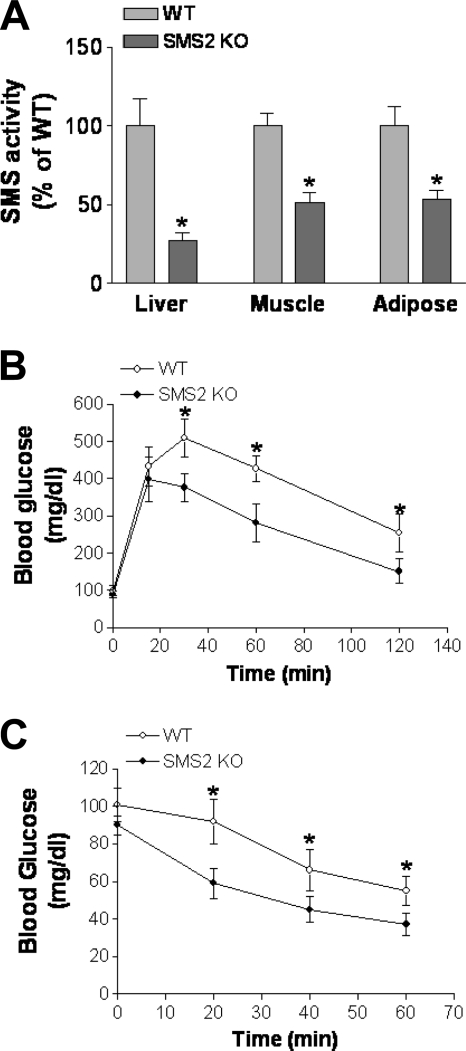
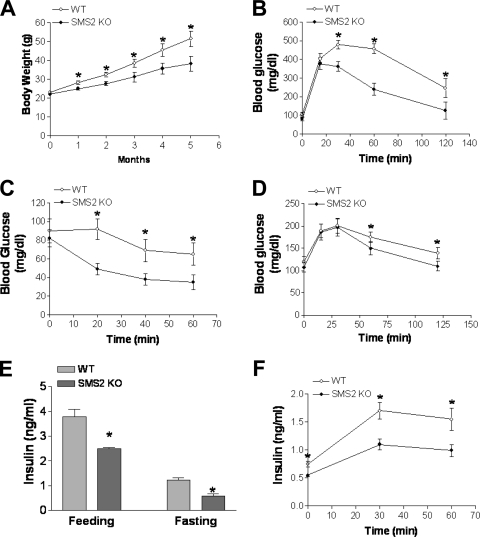
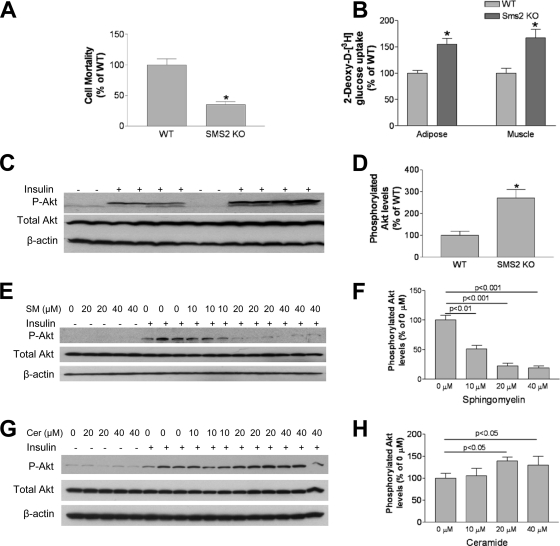
It has been shown that inhibition of de novo sphingolipid synthesis increases insulin sensitivity. For further exploration of the mechanism involved, we utilized two models: heterozygous serine palmitoyltransferase (SPT) subunit 2 (Sptlc2) gene knockout mice and sphingomyelin synthase 2 (Sms2) gene knockout mice. SPT is the key enzyme in sphingolipid biosynthesis, and Sptlc2 is one of its subunits. Homozygous Sptlc2-deficient mice are embryonic lethal. However, heterozygous Sptlc2-deficient mice that were viable and without major developmental defects demonstrated decreased ceramide and sphingomyelin levels in the cell plasma membranes, as well as heightened sensitivity to insulin. Moreover, these mutant mice were protected from high-fat diet-induced obesity and insulin resistance. SMS is the last enzyme for sphingomyelin biosynthesis, and SMS2 is one of its isoforms. Sms2 deficiency increased cell membrane ceramide but decreased SM levels. Sms2 deficiency also increased insulin sensitivity and ameliorated high-fat diet-induced obesity. We have concluded that Sptlc2 heterozygous deficiency- or Sms2 deficiency-mediated reduction of SM in the plasma membranes leads to an improvement in tissue and whole-body insulin sensitivity.


Figures

Fig. 1.
Fig. 1.
Effects of heterozygous Sptlc2 deficiency on glucose, insulin, and pyruvate tolerance tests. Mice were on a chow diet. (A) Tissue SPT activity measurement in Sptlc2+/− and WT mice; (B) Glucose tolerance test; (C) insulin tolerance test; (D) pyruvate tolerance test. Values are means ± SD (n = 10). *, P < 0.01.
Fig. 2.
Fig. 2.
Effects of heterozygous Sptlc2 deficiency on dietary-induced body weight gain and adipose tissues. Mice were fed a high-fat, high-caloric diet for 16 weeks. (A) Quantitative display of body weight gain in Sptlc2+/− and WT mice. (B) Adipose tissue/body weight ratios. (C) Decrease of adipocyte size in Sptlc2+/− mice. Hematoxylin- and eosin-stained sections of adipose tissues from WT and Sptlc2+/− mice are shown. Images were captured at 10× magnification. The frequency distribution shows adipocyte cell surface areas from five WT and five Sptlc2+/− mice. More than 200 cells were measured for each mouse. The distribution includes 1,115 cells from WT and 1,207 from Sptlc2+/− mice. (D) Mean surface area of adipocytes. Values are means ± SD (n = 10). *, P < 0.01.
Fig. 3.
Fig. 3.
Effects of heterozygous Sptlc2 deficiency on glucose tolerance, insulin tolerance, and plasma insulin levels. Mice were fed a high-fat, high-calorie diet for 16 weeks. (A) Glucose tolerance test; (B) insulin tolerance test; (C) fasting and feeding plasma insulin level measurements; (D) plasma insulin levels after glucose injection. Values are means ± SD (n = 10). *, P < 0.01.
Fig. 4.
Fig. 4.
Heterozygous Sptlc2 deficiency has no effect on beta cell mass and proliferation. (A and B) Photomicrographs illustrating sections of the pancreas of WT (A) and Sptlc2 KO (B) mice immunostained for visualization of insulin, using diaminobenzidine as a substrate. Islets were visualized by the brown reaction product on beta cells. Similarly processed sections were used for morphometric analysis of beta cell mass. Bar, 150 μm. (C) Histogram analyzing the presence of similar beta cell mass in Sptlc2 KO and littermate controls. Beta cell mass was determined as described in Materials and Methods (n = 3, with at least 10 fields per mouse/strain evaluated). (D and E) Photomicrographs illustrating beta cells in a section of WT (D) and Sptlc2 KO (E) that were processed for visualization of insulin and the proliferation marker Ki67. Note that the cell indicated with green is IN+ Ki67+. Bar, 20 μm. (F) Histogram documenting the percentage of proliferating (IN+ Ki67+) cells per total number of IN+ cells scored. At least 6,000 IN+ cells were scored per mouse, and 3 mice per strain were analyzed.
Fig. 5.
Fig. 5.
Effects of heterozygous Sptlc2 deficiency on insulin signaling. Mice were fed a high-fat, high-caloric diet for 16 weeks. (A) Phosphorylated insulin receptor measurements by Western blotting. IR-P, phosphorylated insulin receptor; IR, total insulin receptor; β-actin, loading control. (B) Quantitative display of phosphorylated insulin receptor in liver, adipose tissues, and muscles. (C) Phosphorylated Akt measurements by Western blotting. Akt-P, phosphorylated Akt. (D) Quantitative display of phosphorylated Akt in liver, adipose tissues, and muscles. Values are means ± SD (n = 6). *, P < 0.01. (E) GLUT4 immunostaining. Muscle and adipose tissue cryosections (10 μm) were fixed with 4% paraformaldehyde and incubated with a primary antibody to GLUT4. The appropriate secondary antibody conjugated with fluorescein Cy3 was used to detect the signal. The sections were examined by fluorescence microscopy (Nikon). The results shown are representative of three independent experiments. (F) Glucose uptake measurement. Mice fasted for 16 h were injected intravenously with 1 × 10⁶ dpm of 2-deoxy-d-[3H]glucose. Blood was collected after 60 min. Tissues were then excised, and accumulated radioactivity of 2-deoxy-d-[3H]glucose was measured. The amount of glucose injected was adjusted based on plasma radioactivity counts at 60 s after each injection and was compared with plasma counts at the end of the experiments. Tissue uptake for Sptlc2+/ mice was compared with uptake of WT littermates. Values are means ± SD (n = 10). *, P < 0.05.
Fig. 6.
Fig. 6.
Effects of heterozygous Sptlc2 deficiency on phosphorylation of insulin receptor and Akt (on chow). Mice were fed a chow diet for 6 months. (A) Phosphorylated insulin receptor measurement. Thirty minutes after insulin treatment, the liver, hind limb muscles, and adipose tissues were removed and treated as described in Materials and Methods. The total phosphorylated proteins were immunoprecipitated with a phosphorylation antibody plus agarose beads at 4°C overnight. Immunoprecipitated samples were subjected to SDS-PAGE and then transferred to nitrocellulose membranes. Blots were probed with anti-insulin receptor β-subunit antibody. Blots were developed with a chemiluminescence detection system. IR-P, phosphorylated insulin receptor; IR, total insulin receptor; β-actin, loading control. (B) Quantitative display of phosphorylated insulin receptor levels in the liver, adipose tissues, and muscles. Displayed are means ± SD (n = 6). (C) Phosphorylated Akt measurements. Tissue homogenates (50 μg protein) were subjected to SDS-PAGE and then transferred to nitrocellulose membranes. The blots were probed sequentially, first with an anti-phospho-Akt antibody (Cell Signaling) and then with an anti-Akt antibody (Cell Signaling). Akt-P, phosphorylated Akt. (D) Quantitative display of phosphorylated Akt in the liver, adipose tissue, and muscle. Displayed are means ± SD (n = 6).
Fig. 7.
Fig. 7.
Heterozygous Sptlc2 deficiency increases the levels of phosphorylated insulin receptor in liver lipid rafts. Mice were fed a high-fat, high-caloric diet for 16 weeks. (A) Lysenin-mediated cell lysis assay. (B) Lipid raft isolation according to the method described in the text. Fractions (1 to 12) were collected from the top to the bottom after gradient centrifugation. Each fraction was used for the detection of Lyn kinase, caveolin-1, phosphorylated insulin receptor, and total insulin receptor. (C) SM measured by enzymatic assay in each fraction. (D) Fractions 4 to 6 (lipid rafts) and fractions 10 to 12 (nonrafts) were pooled. Phosphorylated insulin receptor and total insulin receptor in both rafts and nonrafts before and after insulin stimulation were detected by Western blotting. (E) Quantitative display of phosphorylated insulin receptor in the liver lipid rafts and nonrafts. (F) Mouse liver plasma membranes were isolated, and purity was determined by Western blotting of a plasma membrane marker (Na/K-ATPase) and a mitochondrial marker (Cox IV).
Fig. 8.
Fig. 8.
Effects of Sms2 deficiency on SMS activity, glucose tolerance, and insulin tolerance. Mice were fed a chow diet. (A) Tissue SMS activity measurements in Sms2 KO and WT mice; (B) glucose tolerance test; (C) insulin tolerance test. Values are means ± SD (n = 10). *, P < 0.01.
Fig. 9.
Fig. 9.
Effects of Sms2 deficiency on diet-induced body weight gain, glucose tolerance, insulin tolerance, pyruvate tolerance, and plasma insulin levels. (A) Quantitative display of body weight gain in Sms2 KO and WT mice during the 20-week high-fat-diet feeding; (B) glucose tolerance test; (C) insulin tolerance test; (D) pyruvate tolerance test; (E) fasting and feeding plasma insulin level measurements; (F) plasma insulin levels after glucose injection. Values are means ± SD (n = 10). *, P < 0.01.
Fig. 10.
Fig. 10.
Effects of Sms2 deficiency on insulin signaling. (A) Lysenin-mediated cell lysis assay. (B) Liver Akt phosphorylation measurement. (C) Quantitative display of Akt phosphorylation. (D) Effects of exogenous SM on Akt phosphorylation. HepG2 cells were incubated with exogenous SM at 0, 10, 20, or 40 μM for 5 h; the cells were then treated with 100 nM insulin for 10 min, and Akt phosphorylation in whole-cell homogenates was measured. (E) Quantitative display of phosphorylated Akt. (F) Effects of exogenous ceramide (C16:0) on Akt phosphorylation. HepG2 cells were incubated with 0, 10, 20, or 40 μM exogenous ceramide for 5 h; the cells were then treated with 100 nM insulin for 10 min, and Akt phosphorylation in whole-cell homogenates was measured. (G) Quantitative display of phosphorylated Akt. Values are means ± SD (n = 5). *, P < 0.01.

References

    1. Adams J. M., II, et al. 2004. Ceramide content is increased in skeletal muscle from obese insulin-resistant humans. Diabetes 53:25–31 - PubMed
    1. Aerts J. M., et al. 2007. Pharmacological inhibition of glucosylceramide synthase enhances insulin sensitivity. Diabetes 56:1341–1349 - PMC - PubMed
    1. Chang L., Chiang S. H., Saltiel A. R. 2004. Insulin signaling and the regulation of glucose transport. Mol. Med. 10:65–71 - PMC - PubMed
    1. de Mello V. D., et al. 2009. Link between plasma ceramides, inflammation and insulin resistance: association with serum IL-6 concentration in patients with coronary heart disease. Diabetologia 52:2612–2615 - PubMed
    1. Drab M., et al. 2001. Loss of caveolae, vascular dysfunction, and pulmonary defects in caveolin-1 gene-disrupted mice. Science 293:2449–2452 - PubMed

Publication types

MeSH terms