

Central nervous system immune activation characterizes primary human immunodeficiency virus 1 infection even in participants with minimal cerebrospinal fluid viral burden
- PMID: 21844301
- PMCID: PMC3156103
- DOI: 10.1093/infdis/jir387
Central nervous system immune activation characterizes primary human immunodeficiency virus 1 infection even in participants with minimal cerebrospinal fluid viral burden
Abstract
Background: Central nervous system (CNS) human immunodeficiency virus (HIV) infection and immune activation lead to brain injury and neurological impairment. Although HIV enters the nervous system soon after transmission, the magnitude of infection and immunoactivation within the CNS during primary HIV infection (PHI) has not been characterized.
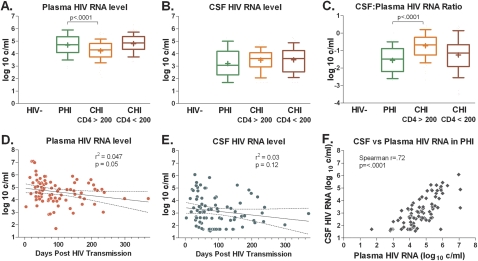
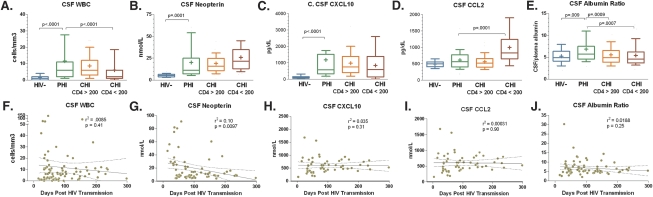
Methods: This cross-sectional study analyzed cerebrospinal fluid (CSF) and blood from 96 participants with PHI and compared them with samples from neuroasymptomatic participants with chronic infection and ≥ 200 or < 200 blood CD4 T cells/μL, and with samples from HIV-seronegative participants with respect to CSF and plasma HIV RNA, CSF to serum albumin ratio, and CSF white blood cell counts (WBC), neopterin levels, and concentrations of chemokines CXCL10 and CCL2.
Results: The PHI participants (median 77 days post transmission) had CSF HIV RNA, WBC, neopterin, and CXCL10 concentrations similar to the chronic infection participants but uniquely high albumin ratios. 18 participants had ≤ 100 copies/mL CSF HIV RNA, which was associated with low CSF to plasma HIV ratios and levels of CSF inflammation lower than in other PHI participants but higher than in HIV-seronegative controls.
Conclusions: Prominent CNS infection and immune activation is evident during the first months after HIV transmission, though a proportion of PHI patients demonstrate relatively reduced CSF HIV RNA and inflammation during this early period.
Figures

References
-
- Navia BA, Jordan BD, Price RW. The AIDS dementia complex: I. Clinical features. Ann Neurol. 1986;19:517–24. - PubMed
-
- Wong MH, Robertson K, Nakasujja N, et al. Frequency of and risk factors for HIV dementia in an HIV clinic in sub-Saharan Africa. Neurology. 2007;68:350–5. - PubMed
-
- Sacktor N, McDermott MP, Marder K, et al. HIV-associated cognitive impairment before and after the advent of combination therapy. J Neurovirol. 2002;8:136–42. - PubMed
-
- Brew BJ. Evidence for a change in AIDS dementia complex in the era of highly active antiretroviral therapy and the possibility of new forms of AIDS dementia complex. AIDS. 2004;18:S75–8. - PubMed
-
- Venturi G, Catucci M, Romano L, et al. Antiretroviral resistance mutations in human immunodeficiency virus type 1 reverse transcriptase and protease from paired cerebrospinal fluid and plasma samples. J Infect Dis. 2000;181:740–5. - PubMed
Publication types
MeSH terms
Substances
Grants and funding
LinkOut - more resources
Full Text Sources
Medical
Research Materials
