. 2011 Sep 15;187(6):3121-32.
doi: 10.4049/jimmunol.1100378. Epub 2011 Aug 15.

Functional gap junctions accumulate at the immunological synapse and contribute to T cell activation

Affiliations

Functional gap junctions accumulate at the immunological synapse and contribute to T cell activation

Ariadna Mendoza-Naranjo et al. J Immunol. .

Abstract

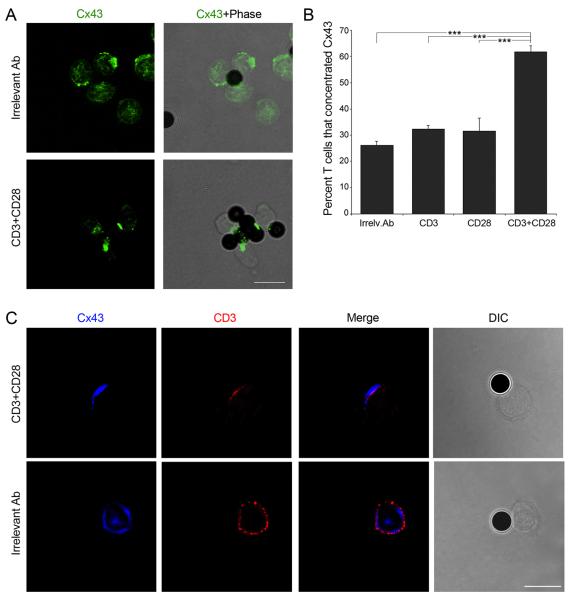
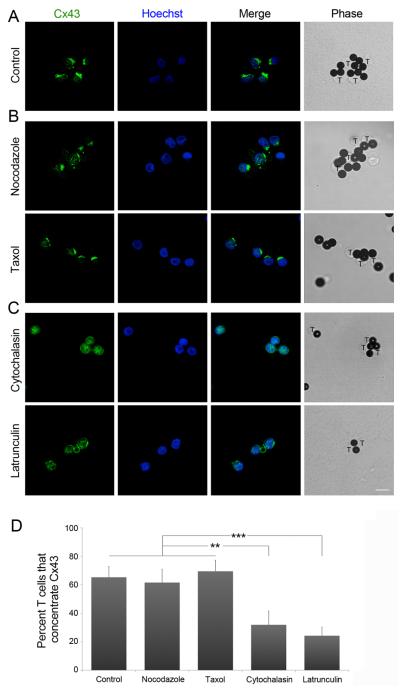
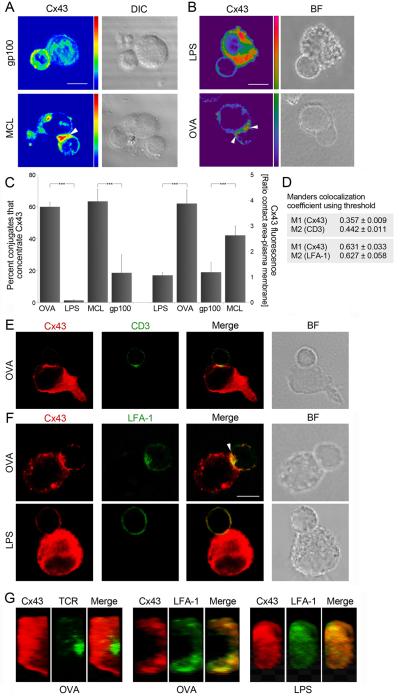
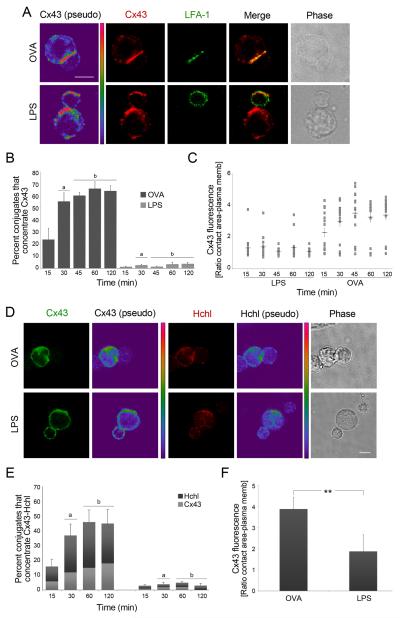
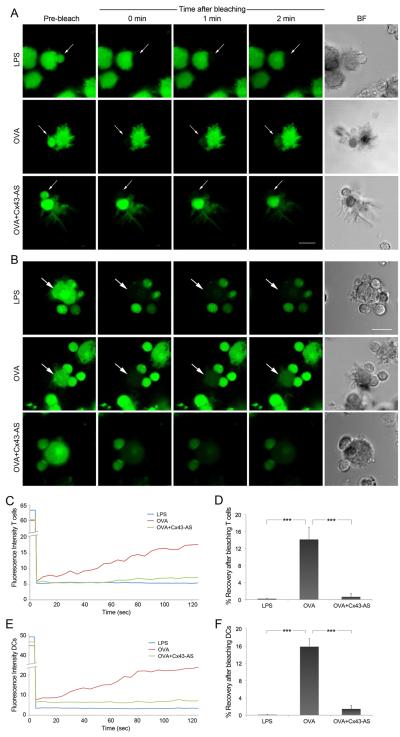
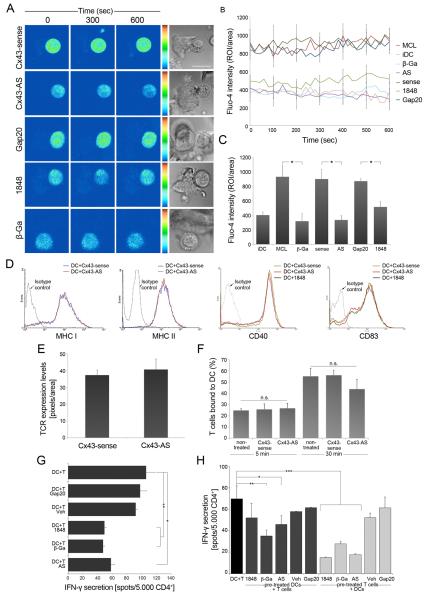
Gap junction (GJ) mediates intercellular communication through linked hemichannels from each of two adjacent cells. Using human and mouse models, we show that connexin 43 (Cx43), the main GJ protein in the immune system, was recruited to the immunological synapse during T cell priming as both GJs and stand-alone hemichannels. Cx43 accumulation at the synapse was Ag specific and time dependent, and required an intact actin cytoskeleton. Fluorescence recovery after photobleaching and Cx43-specific inhibitors were used to prove that intercellular communication between T cells and dendritic cells is bidirectional and specifically mediated by Cx43. Moreover, this intercellular cross talk contributed to T cell activation as silencing of Cx43 with an antisense or inhibition of GJ docking impaired intracellular Ca(2+) responses and cytokine release by T cells. These findings identify Cx43 as an important functional component of the immunological synapse and reveal a crucial role for GJs and hemichannels as coordinators of the dendritic cell-T cell signaling machinery that regulates T cell activation.


Figures

Figure 1
Figure 1. Co-stimulatory signals induce Cx43 accumulation at the contact site
(A) Cx43 distribution was analyzed in T cells stimulated with magnetic beads coated with anti-CD3 and anti-CD28, or with an irrelevant Ab. Scale bar = 10 μm. (B) The number of T cells that accumulate Cx43 at the site contacting the beads was quantified under the different conditions studied. Values are expressed as the percentage of cells that polarized Cx43 to the contact site, relative to the total number of cells examined. Each plotted point represents mean ± SD of four independent experiments. Differences are indicated by P-values (***, p < 0.005). (C) The distribution of Cx43 and CD3 was analyzed by confocal microscopy in T cells stimulated with magnetic beads coated with an irrelevant Ab or with anti-CD3 plus anti-CD28. Images are representative of three independent experiments. Scale bar = 10 μm.
Figure 2
Figure 2. Recruitment of Cx43 is an actin-dependent process
PBLs were incubated for 30 min in the presence, or (A) absence, of (B) taxol or nocodazole, or (C) cytochalasin D or latrunculin A, before incubation with CD3 and CD28-coated beads. Cx43 and Hoechst staining were analyzed by confocal microscopy. The inducible capping of Cx43 to the contact area was impaired in the presence of the inhibitors of actin polymerization. Scale bar = 10 μm. (D) The number of T cells that accumulate Cx43 at the site contacting the beads was quantified under the different conditions studied. Values are expressed as the percentage of cells that recruit Cx43 to the IS, relative to the total number of cells examined. Differences are indicated by P-values (**, p < 0.01; ***, p < 0.005).
Figure 3
Figure 3. Cx43 is recruited to the IS and accumulates preferentially in the pSMAC between T cells and DC
Cx43 accumulates at the site of interaction of (A) MCL-DCs and MCL-specific T cells (arrowheads), and (B) OVA-DCs and OT-II CD4+ T cells (arrowheads); but distributes homogeneously in T cells incubated with gp100-DCs and LPS-DCs (A and B, respectively). Scale bar = 5 μm. (C) The number of T cells that accumulate Cx43 at the site of contact, and the ratio of Cx43 fluorescence accumulated at the contact area vs. at the plasma membrane were quantified. Values are expressed as mean ± SD of three independent experiments. Differences are indicated by P-values (***, p < 0.005). (D) The colocalization coefficients for Cx43 (M1 channel) and for CD3 or LFA-1 (M2 channel) were calculated using Manders’ automatic threshold determination. Manders’ coefficients range from 0 (no overlap) to 1 (complete overlap). Values appear indicated as mean ± SEM. Cells were co-stained for Cx43 and: (E) CD3 and (F) LFA-1 distribution was evaluated by confocal microscopy in conjugates of OVA-DCs (or LPS-DCs, in F) and OT-II T cells. Cx43 was found partially co-localizing with CD3 (E) and was mainly accumulated in the pSMAC within the IS (F, arrowhead). Scale bar = 5 μm. (G) En face views illustrating the Cx43 accumulation at the DC-T cell interface. Cx43 was preferentially concentrated in the peripheral (pSMAC) area of the immunological synapse.
Figure 4
Figure 4. Cx43 and Cx43-Hchls accumulate at the IS in a time-dependent and Ag-specific way
(A) Representative images of Cx43 and LFA-1 distribution after incubation of OVA-DCs or LPS-DCs with OT-II T cells are shown. Scale bar = 5 μm. (B) Cx43 accumulation at the IS was evaluated at different time points based on positive co–staining of Cx43 and LFA-1 in OVA-DCs or LPS-DCs co-cultured with OT-II T cells. Each plotted point represents mean ± SD of three independent experiments (a: p < 0.01 and b: p < 0.005). (C) Cx43 distribution to the synapse was measured as ratio of Cx43 accumulated at the contact site vs. at the plasma membrane, and was evaluated at different time points. Cx43 accumulation was significantly higher in T cells co-cultured with OVA-DCs vs. LPS-DCs (30 min: p < 0.01; and 45, 60 and 120 min: p < 0.005). Values are expressed as mean ± SEM; n = 3. (D) Hchls and Cx43 accumulates at the site of interaction of OVA-DCs and OT-II CD4+ T cells, but distributes randomly in T cells incubated with LPS-DCs. Scale bar = 5 μm. (E) The percentage of cells that accumulated Hchls (dark grey) and Cx43 (light grey) at the synapse was assessed. Values are reported as mean ± SEM (a: p < 0.05 and b: p < 0.01). (F) The ratio of Cx43 fluorescence accumulated at the contact area vs. at the plasma membrane was quantified 2 h after DC-T cells conjugates formation. Values are expressed as mean ± SD of three independent experiments. Differences are indicated by P-values (**, p < 0.01).
Figure 5
Figure 5. DCs and T cells communicate through functional GJs
(A) FRAP experiments were carried out in conjugated formed between LPS-DCs or OVA-DCs and OT-II T cells. Co-cultures of OVA-DCs and T cells pre-treated 4 h with a Cx43-AS were also analyzed. After loading both cell populations with calcein-AM (green), T cells were bleached and the fluorescence recovery was monitored over a period of 2 min. Representative images of fluorescence restoration (or not) and bright field (BF) images are shown. Arrows indicate the target cell before and after photobleaching. Scale bar = 10 μm. (B) OVA-DCs or LPS-DCs, and OT-II T cells were loading with calcein-AM (green), DCs were bleached and the fluorescence recovery in the photobleached region was monitored over a period of 2 min. Representative images of fluorescence restoration (or not) and bright field images corresponding to the same fields are shown. Arrows indicate the target cell before and after photobleaching. Scale bar = 10 μm. (C and E) Representative fluorescence recovery curves for T cells and DCs, respectively illustrating the kinetic profile for each condition are shown. Recovery was confirmed only between OVA-DCs and OT-II T cells conjugates and was negative for the other conditions. (D and F) Data was analyzed to show the incidence of dye coupling after photobleaching of T cells or DCs, respectively. Mean values were expressed as percentage ± SEM (*, p < 0.05); n = 3.
Figure 6
Figure 6. Cx43 contributes to T cell activation by DC
(A) Ca2+ signalling was analyzed using Fluo4-AM by sequential confocal images of MCL-specific T cells co-cultured with autologous MCL-DCs and treated with different GJs or Cx43 inhibitors and their respective controls. Phase-contrast images corresponding to the same fields are shown. Scale bar = 5 μm. (B) Time course showing changes of intracellular Ca2+ signalling in T cells contacting DCs, under different conditions. Ca2+ signals are shown as total mean fluorescence ± SEM. (C) Overall mean of Fluo4-AM fluorescence over the time ± SEM for each condition (*, p < 0.05); n = 3. (D and E) Treatments with a Cx43-AS or with the 1848 Cx43-mimetic peptide did not affect the expression of MHC class I and class II, CD40, CD83 and TCR. (F) Cell adhesion was evaluated in conjugates of OVA-DCs and OT-II T cells treated or not with a Cx43-sense or Cx43 AS. Cx43 gene targeting did not affect conjugate formation 5 min and 30 min after DCs-T cells co-incubation. Each bar represents percentage ± SD of four independent experiments. (G) IFN-γ secretion was assessed by ELISPOT assay in MCL-specific CD4+ T cells co-incubated with MCL-DCs, plus a non-specific GJ blocker (β-Ga), Cx43-AS or 1848 Cx43-mimetic peptide. Inhibition of GJIC significantly reduced the secretion of IFN-γ by CD4+ T cells. Data were expressed as the mean of spots / 5 × 10³ effector cells ± SD (**, p < 0.01; *, p < 0.05), n = 2, performed in triplicate). (H) MCL-DCs or MCL-specific T cells were independently pre-treated with β-Ga, 1848-mimetic peptide, Cx43-AS or their respective controls, and then incubated with non-treated T cells (dark grey) or DCs (light grey), respectively. Control, non-treated T cells and DCs (black) were also evaluated. Graphic represents IFN-γ secretion reported as the mean of spots / 5 × 10³ CD4+ T cells ± SD (*, p < 0.05; **, p < 0.01 and ***, p < 0.005) n = 2, performed in triplicate.

References

    1. Babbitt BP, Allen PM, Matsueda G, Haber E, Unanue ER. Binding of immunogenic peptides to Ia histocompatibility molecules. Nature. 1985;317:359–361. - PubMed
    1. Hedrick SM, Nielsen EA, Kavaler J, Cohen DI, Davis MM. Sequence relationships between putative T-cell receptor polypeptides and immunoglobulins. Nature. 1984;308:153–158. - PubMed
    1. Grakoui A, Bromley SK, Sumen C, Davis MM, Shaw AS, Allen PM, Dustin ML. The immunological synapse: a molecular machine controlling T cell activation. Science. 1999;285:221–227. - PubMed
    1. Monks CR, Freiberg BA, Kupfer H, Sciaky N, Kupfer A. Three-dimensional segregation of supramolecular activation clusters in T cells. Nature. 1998;395:82–86. - PubMed
    1. Trautmann A, Valitutti S. The diversity of immunological synapses. Curr Opin Immunol. 2003;15:249–254. - PubMed

Publication types

MeSH terms