Clinical Trial
. 2011 Sep 15;187(6):3391-401.
doi: 10.4049/jimmunol.1101421. Epub 2011 Aug 15.

HIV-DNA priming alters T cell responses to HIV-adenovirus vaccine even when responses to DNA are undetectable

Affiliations
Clinical Trial

HIV-DNA priming alters T cell responses to HIV-adenovirus vaccine even when responses to DNA are undetectable

Stephen C De Rosa et al. J Immunol. .

Abstract

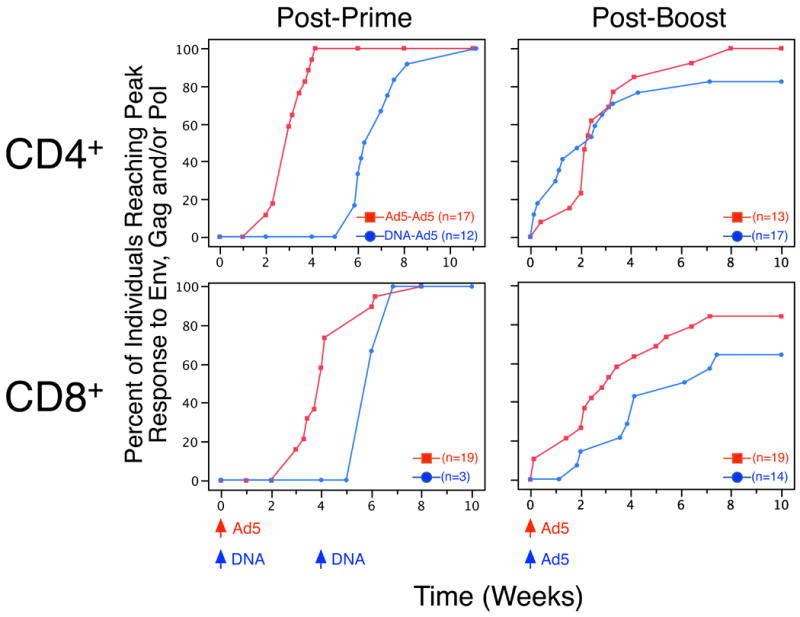
Many candidate HIV vaccines are designed to primarily elicit T cell responses. Although repeated immunization with the same vaccine boosts Ab responses, the benefit for T cell responses is ill defined. We compared two immunization regimens that include the same recombinant adenoviral serotype 5 (rAd5) boost. Repeated homologous rAd5 immunization fails to increase T cell responses, but increases gp140 Ab responses 10-fold. DNA prime, as compared with rAd5 prime, directs long-term memory CD8(+) T cells toward a terminally differentiated effector memory phenotype with cytotoxic potential. Based on the kinetics of activated cells measured directly ex vivo, the DNA vaccination primes for both CD4(+) and CD8(+) T cells, despite the lack of detection of the latter until after the boost. These results suggest that heterologous prime-boost combinations have distinct immunological advantages over homologous prime-boosts and suggest that the effect of DNA on subsequent boosting may not be easily detectable directly after the DNA vaccination.


Figures

Figure 1
Figure 1. Kinetics of percentage of responding individuals and percentage of cytokine-producing cells
For all graphs and all subsequent figures, the Ad5-Ad5 group is shown in red and the DNA-Ad5 group in blue. A. The percentage of individuals in each trial group with CD4+ or CD8+ T-cell responses determined to be positive for Env, Gag or Pol or for any protein (overall) is shown at each timepoint. B. The median percentage of cells producing IFN-γ and/or IL-2 in response to in vitro stimulation with Env, Gag, or Pol peptide pools, or the sum of these (total), is shown at each timepoint. Within each graph, only individuals with at least one positive response at any timepoint are included (this number is listed on each graph). C. The percentage of cells producing IFN-γ and/or IL-2 is shown for three timepoints – four weeks after prime, boost and six months after boost. Within each graph, data are shown for all individuals with at least one positive response at any timepoint. The numbers on the graphs indicate adjusted p-values (unadjusted in parentheses). For the DNA-Ad5 group, four weeks post-prime is four weeks following the second DNA vaccination. The box plots indicate the median, 25th and 75th percentiles; whiskers extend to the furthest point within 1.5 times the interquartile range.
Figure 2
Figure 2. The percentages of Env-specific CD4+ and CD8+ T cells co-producing IFN-γ and IL-2
Only responses determined to be positive at the indicated timepoints are shown. The numbers on the graphs indicate adjusted p-values (unadjusted in parentheses). For the DNA-Ad5 group, four weeks post-prime is four weeks following the second DNA vaccination. The box plots indicate the median, 25th and 75th percentiles; whiskers extend to the furthest point within 1.5 times the interquartile range.
Figure 3
Figure 3. Expression of CD45RA and CD57 on Env-specific CD4+ and CD8+ T cells
A. The four potential combinations of CD45RA and CD57 expression are shown on the x-axis. The percentage of Env-specific CD4+ or CD8+ T cells (identified by expression of IFN-γ and/or IL-2) expressing each combination is shown on the y-axis at each timepoint. B. The percentage of Env-specific CD8+ T cells expressing granzyme B at six months post-boost is shown. For all graphs, only responses determined to be positive at the indicated timepoints are shown. The numbers on the graphs indicate adjusted p-values (unadjusted in parentheses). For the DNA-Ad5 group, four weeks post-prime is four weeks following the second DNA vaccination. The box plots indicate the median, 25th and 75th percentiles; whiskers extend to the furthest point within 1.5 times the interquartile range.
Figure 4
Figure 4. Representation of the time at which peak response is reached
Cumulative distribution graphs are shown for the time to reach the peak total response after the prime (left) or the boost (right) for CD4+ (upper) and CD8+ (lower) T cells. Time (weeks) is shown on the x-axis, and the proportion of individuals reaching the peak on or before that time is shown on the y-axis. Peak response is determined as the maximum within an individual for the CD4+ or CD8+ T cells producing IFN-γ and/or IL-2 summed for Env, Gag and Pol. Only individuals with at least one positive response after prime or after boost are shown. Some individuals reached the peak response more than 10 weeks following the boost.
Figure 5
Figure 5. Activated T cells detected following vaccination
A. Higher proportion of activated T cells is detected using Ki-67 and BcL-2 as compared with CD38 and HLA-DR. Flow cytometric staining profile in one Ad5-Ad5 individual one week after the rAd5 boost shows expression of Ki-67 and BcL-2 in the left panels. Numbers indicate percentage of CD4+ or CD8+ T cells that are Ki-67+BcL-2lo. Right panels show expression of CD38 and HLA-DR. The Ki-67+BcL-2lo cells are shown in red as overlay on the total T cells (gray). Numbers indicate the percentage of the Ki-67+BcL-2lo cells that co-express CD38 and HLA-DR. B. The median percentages of CD4+ and CD8+ T cells that are Ki-67+BcL-2lo at each timepoint are shown for the Ad5-Ad5 (upper) and DNA-Ad5 (lower) groups. Medians are for a total of 16 vaccine recipients in each trial group for whom the assay was performed. C. The percentage of CD4+ and CD8+ T cells that are Ki-67+BcL-2lo at two weeks post-prime (first rAd5 or second DNA) and one week post-boost. The box plots indicate the median, 25th and 75th percentiles; whiskers extend to the furthest point within 1.5 times the interquartile range.
Figure 6
Figure 6. HIV-specific antibody responses
A. Antibodies to gp140, gp41 and p55 as measured by ELISA are shown as optical density (O.D.). These were measured at week 0, four weeks following the second DNA, and four weeks following the rAd5 prime and boost. Data for the six control participants at all three timepoints are shown grouped together. Data are background subtracted. The comparison between treatment groups post-boost is significant only for gp140 (adjusted p=0.02). The post-rAd5 response in the DNA-Ad5 group is significantly greater than the post-prime response in the Ad5-Ad5 group for gp140 and gp41. Asterisks indicate significance between adjacent groups: *p<0.001, **p<0.05. B. HIV Env-specific antibody responses are higher in the Ad5-Ad5 group compared with the DNA-Ad5 group when measured four weeks following the rAd5 boost using a standardized HIV-1 Luminex assay. Serum HIV-1 specific IgG responses to Clade B Consensus (BCon) gp140, Group M Consensus (ConS) gp140, and Con6 gp120 were measured and results are expressed as equivalence concentration for 2G12 monoclonal antibody. The box plots indicate the median, 25th and 75th percentiles; whiskers extend to the furthest point within 1.5 times the interquartile range.

References

    1. Walker BD, Burton DR. Toward an AIDS vaccine. Science (New York, NY. 2008;320:760–764. - PubMed
    1. Cox KS, Clair JH, Prokop MT, Sykes KJ, Dubey SA, Shiver JW, Robertson MN, Casimiro DR. DNA gag/adenovirus type 5 (Ad5) gag and Ad5 gag/Ad5 gag vaccines induce distinct T-cell response profiles. Journal of virology. 2008;82:8161–8171. - PMC - PubMed
    1. Buchbinder SP, Mehrotra DV, Duerr A, Fitzgerald DW, Mogg R, Li D, Gilbert PB, Lama JR, Marmor M, Del Rio C, McElrath MJ, Casimiro DR, Gottesdiener KM, Chodakewitz JA, Corey L, Robertson MN. Efficacy assessment of a cell-mediated immunity HIV-1 vaccine (the Step Study): a double-blind, randomised, placebo-controlled, test-of-concept trial. Lancet. 2008;372:1881–1893. - PMC - PubMed
    1. Rerks-Ngarm S, Pitisuttithum P, Nitayaphan S, Kaewkungwal J, Chiu J, Paris R, Premsri N, Namwat C, de Souza M, Adams E, Benenson M, Gurunathan S, Tartaglia J, McNeil JG, Francis DP, Stablein D, Birx DL, Chunsuttiwat S, Khamboonruang C, Thongcharoen P, Robb ML, Michael NL, Kunasol P, Kim JH. Vaccination with ALVAC and AIDSVAX to prevent HIV-1 infection in Thailand. N Engl J Med. 2009;361:2209–2220. - PubMed
    1. Graham BS, Koup RA, Roederer M, Bailer RT, Enama ME, Moodie Z, Martin JE, McCluskey MM, Chakrabarti BK, Lamoreaux L, Andrews CA, Gomez PL, Mascola JR, Nabel GJ. Phase 1 safety and immunogenicity evaluation of a multiclade HIV-1 DNA candidate vaccine. The Journal of infectious diseases. 2006;194:1650–1660. - PMC - PubMed

Publication types

MeSH terms