. 2012 Jun;17(6):650-62.
doi: 10.1038/mp.2011.93. Epub 2011 Aug 16.

Dopamine D4 receptor, but not the ADHD-associated D4.7 variant, forms functional heteromers with the dopamine D2S receptor in the brain

Affiliations

Dopamine D4 receptor, but not the ADHD-associated D4.7 variant, forms functional heteromers with the dopamine D2S receptor in the brain

S González et al. Mol Psychiatry. 2012 Jun.

Abstract

Polymorphic variants of the dopamine D(4) receptor have been consistently associated with attention-deficit hyperactivity disorder (ADHD). However, the functional significance of the risk polymorphism (variable number of tandem repeats in exon 3) is still unclear. Here, we show that whereas the most frequent 4-repeat (D(4.4)) and the 2-repeat (D(4.2)) variants form functional heteromers with the short isoform of the dopamine D(2) receptor (D(2S)), the 7-repeat risk allele (D(4.7)) does not. D(2) receptor activation in the D(2S)-D(4) receptor heteromer potentiates D(4) receptor-mediated MAPK signaling in transfected cells and in the striatum, which did not occur in cells expressing D(4.7) or in the striatum of knockin mutant mice carrying the 7 repeats of the human D(4.7) in the third intracellular loop of the D(4) receptor. In the striatum, D(4) receptors are localized in corticostriatal glutamatergic terminals, where they selectively modulate glutamatergic neurotransmission by interacting with D(2S) receptors. This interaction shows the same qualitative characteristics than the D(2S)-D(4) receptor heteromer-mediated mitogen-activated protein kinase (MAPK) signaling and D(2S) receptor activation potentiates D(4) receptor-mediated inhibition of striatal glutamate release. It is therefore postulated that dysfunctional D(2S)-D(4.7) heteromers may impair presynaptic dopaminergic control of corticostriatal glutamatergic neurotransmission and explain functional deficits associated with ADHD.


Conflict of interest statement

Conflict of interest

The authors declare no conflict of interest

Figures

Figure 1
Figure 1. Human D2S and D4 receptors form heteromers in transfected cells
a) BRET saturation curves were obtained from experiments with cells co-expressing, top to bottom, D2S-YFP and D4.2-RLuc (red), D4.4-RLuc (green) or D4.7-Rluc (blue), D2S-RLuc and D4.7-YFP (purple), A1-RLuc and D2S-YFP (black) or D4.4-RLuc and D1-YFP (gray). Co-transfections were performed with a constant amount of cDNA corresponding to the receptor-RLuc construct (2 µg of cDNA for D4-RLuc or 1 µg of cDNA for A1-RLuc) and increasing amounts of cDNA corresponding to the receptor-YFP construct (0.2–6 µg of cDNA for D2S-YFP or 1–4 µg of cDNA for D1-YFP). Both fluorescence and luminescence of each sample were measured prior to every experiment to confirm equal expression of Rluc (about 100,000 luminescence units) while monitoring the increase of YFP expression (2000 to 20,000 fluorescence units). BRET data are expressed as means ± S.D. of four to nine different experiments grouped as a function of the amount of BRET acceptor. (b) BRET displacement experiments were performed in cells expressing constant amounts of D4.4-RLuc (2 µg cDNA transfected) and D2S-YFP (2µg cDNA tranfected) and increasing amounts (1–5 µg of cDNA transfected) of D4.7 (blue) or D4.2 (green). Both fluorescence and luminescence of each sample were measured prior to every experiment to confirm no changes in the expression of D4.4-RLuc and D2S-YFP. BRET data are expressed as means ± S.D. of five different experiments grouped as a function of the amount of BRET acceptor. Significant differences with respect to the samples without D4.2 or D4.7 were calculated by one-way ANOVA and Bonferroni’s test. (**P < 0.01 and ***P < 0.001). In (a) and (b) the relative amounts of BRET acceptor are expressed as the ratio between the fluorescence of the acceptor minus the fluorescence detected in cells only expressing the donor, and the luciferase activity of the donor. In the top, schematic representations of BRET (a) or BRET displacement (b) are shown. (c) Confocal microscopy images of cells transfected with 1 µg of cDNA corresponding to, left to right, D4.2-RLuc, D4.4-RLuc or D4.7-RLuc and 0.5 µg cDNA corresponding to D2S-YFP. Proteins were identified by fluorescence or by immunocytochemistry. D4-RLuc receptors are shown in red, D2S-YFP is shown in green and co-localization is shown in yellow. Scale bar: 5 µm.
Figure 2
Figure 2. Crosstalk between human D4 and D2S receptors in ERK 1/2 phosphorylation
Cells were transiently co-transfected with 2.5 µg of cDNA corresponding to D2S and 2.5 µg of cDNA corresponding to D4.2 (a and d), D4.4 (b and e) or D4.7 (c and f). In a, b and c, cells were treated for 10 min with increasing concentrations of RO 10-5824 in the presence (○) or in the absence (●) of quinelorane (50 nM). In d, e and f, cells were treated for 10 min with increasing concentrations of quinelorane in the presence (○) or in the absence (●) of RO 10-5824 (50 nM). The immunoreactive bands, corresponding to ERK 1/2 phosphorylation, of three to six experiments were quantified and expressed as arbitrary units. For each curve EC50 values were calculated as mean ± S.E.M. and statistical differences between curves obtained in the presence or in the absence of quinelorane (a, b and c) or RO 10-5824 (d, e and f) were determined by Student’s t test. EC50 with and without quinelorane: (a) 9 ± 1 and 26 ± 1nM (p<0.01), (b) 7 ± 1 and 23 ± 1nM (p<0.01), (c) 18 ± 1 and 22 ± 1 nM (N.S.). EC50 with and without RO 10-5824: (d) 22 ± 1 and 20 ± 1 nM (N.S.), (e) 20 ± 1 and 17 ± 1 nM (N.S.), (f) 18 ± 1 and 13 ± 1nM (N.S.). N.S.: non-statistical differences
Figure 3
Figure 3. D2s-D4 receptor heteromers in the mouse brain
(a) Confocal microscopy images of cells transfected with 1 µg of cDNA corresponding to, left to right, mouse D4-RLuc, human D4.4-RLuc and human D4.7-RLuc and 0.5 µg of cDNA corresponding to D2S-YFP. Proteins were identified by fluorescence or by immunocytochemistry. D4-RLuc receptors are shown in red, D2S-YFP is shown in green and co-localization is shown in yellow. Scale bar: 5 µm. (b) Mouse D2S receptor heteromerization with mouse and human D4 receptors. BRET saturation curves were obtained from cells co-expressing mouse D4-Rluc (green), human D4.4-RLuc (red), human D4.7-RLuc (blue) or human A1-RLuc (gray) and mouse D2S-YFP receptors. Co-transfections were performed with a constant amount of cDNA corresponding to the receptor-RLuc construct (2 µg of cDNA for mouse D4-RLuc, 2.5 µg of cDNA for human D4-RLuc or 1 µg of cDNA for A1-RLuc) and increasing amounts of cDNA corresponding to the receptor-YFP construct (0.2–6 µg cDNA). Both fluorescence and luminescence of each sample were measured prior to every experiment to confirm equal expression of Rluc (about 100,000 luminescence units) while monitoring the increase of YFP expression (2000 to 20,000 fluorescence units). The relative amounts of BRET acceptor are expressed as the ratio between the fluorescence of the acceptor minus the fluorescence detected in cells only expressing the donor, and the luciferase activity of the donor. BRET data are expressed as means ± S.D. of three to six different experiments grouped as a function of the amount of BRET acceptor. (c) and (d) Crosstalk between mouse D2S receptors and mouse or human D4 receptors in ERK 1/2 phosphorylation. Cells transiently co-expressing mouse D2S receptors and mouse D4 receptors (c) or human D4.7 receptors (d) were treated for 10 minutes with increasing RO 10-5824 concentrations in the presence (○) or in the absence (●) of quinelorane (50 nM) prior to the ERK 1/2 phosphorylation determination. The immunoreactive bands of three experiments (mean ± SEM; n = 3) were quantified and expressed as arbitrary units. EC50 values with or without quinelorane were: (c) 7 ± 0.1 and 15 ± 0.1 nM (Student’s t test: p<0.01) or (d) 18 ± 0.1 and 15 ± 0.1 nM (Student’s t test: NS). (e) Striatal slices from wild-type (WT) or D4.7 mutant mice were treated for 10 min with the indicated concentrations of RO 10-5824 (orange) or quinelorane (green) or with RO 10-5824 plus quinelorane (blue) and ERK 1/2 phosphorylation was determined. For each treatment, the immunoreactive bands from 4 to 6 slices from a total 10 WT and 10 D4.7 mutant animals were quantified and values represent the mean ± S.E.M. of the percentage of phosphorylation relative to basal levels found in untreated slices (100 %). No significant differences were obtained between the basal levels of the WT and the D4.7 mutant mice. Significant treatment and genotype effects were shown by a bifactorial ANOVA followed by post-hoc Bonferroni’s tests (** and ***: p<0.01 and p<0.001, respectively, as compared to the lowest concentration of RO 10-5824)
Figure 4
Figure 4. Targeted insertion of human VNTRs carrying 7 repeats into the mouse Drd4 exon 3 by homologous recombination in ES cells
(a) Structure of the Drd4 locus, targeting vector and targeted allele. (b) Southern blot analysis detected double homologous recombination events at the 5' and 3' ends using external probes after digestion with BamHI or EcoRI. (c) The presence of inserted human VNTR was verified by PCR using mouse primers flanking the expansion.
Figure 5
Figure 5. In vivo D4 receptor-mediated modulation of basal extracellular levels of glutamate in the rat ventral striatum
Effects of the local perfusion with the D4 receptor agonist RO 10-5824 and the D4 receptor antagonist L-745,870 on the basal extracellular concentrations of glutamate (GLU) and dopamine (DA) in the ventral striatum (core of the nucleus accumbens). Horizontal bars show the periods of drug perfusion (concentrations are indicated in M). Data represent means ± S.E.M. of the percentage of the mean of the three basal values before the first drug perfusion (n = 6–8/group): * and **: p<0.05 and 0.01, respectively, compared to the values previous in time “0” (repeated measures ANOVA followed by Newman-Keuls tests).
Figure 6
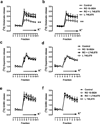
Figure 6. D4 receptor-mediated modulation of [3H]glutamate, but not [3H]dopamine or [3H]GABA release from slices of dorsal and ventral striatum
Slices from the dorsal striatum (caudate-putamen; a, c and e) or the ventral striatum (nucleus accumbens; b, d and f) of reserpine-treated rats were treated with the D4 receptor agonist RO 10-5824 (100 nM) or with the D4 receptor antagonist L745,870 (10 nM) alone or in combination and the time course of K+ stimulated [3H]glutamate (a and b), [3H]dopamine (c and d) or [3H]GABA (e and f) release was determined. The RO 10-5824-induced effect (open circles) was prevented by the antagonist L 745,870 (dark squares) which itself had no effect (open squares). Values are mean ± S.E.M. of samples from 3 different animals performed in 4 replicates. Drug effect was assessed by comparing the relative area under the curve for each condition. **: p<0.01 with respect to the control (ANOVA followed by Tukey-Kramer multiple comparison post hoc test).
Figure 7
Figure 7. D2 and D4 receptor interactions in the modulation of striatal [3H]glutamate release
Striatal slices (dorsal striatum) from reserpine-treated rats were incubated with SCH 23390 (100 nM) to block D1 receptor activation. In (a), slices were treated for 32 min (fraction 2 to fraction 10) with medium (control), with the D4 receptor agonist RO 10-5824 (100 nM), with the D2/3 receptor agonist quinelorane (100 nM) or with both and K+ stimulated [3H]glutamate release was determined. Values are mean ± S.E.M. of samples from 3 different animals performed in 4 replicates. Drug effects were assessed by comparing the relative area under the curve for each condition. **p<0.01 and ***p<0.001 with respect to the control and ## p<0.01 with respect to slices treated with RO 10-5824 or quinelorane alone (ANOVA followed by Tukey-Kramer multiple comparison post hoc test). In (b), slices were treated for 32 min with increasing dopamine concentrations in absence (dark circles) or in the presence of the D4 receptor antagonist L-45,870 (10 nM, dark squares), the D2 receptor antagonist L 741,626 (10 nM, open circles) or both (open squares) and K+ stimulated [3H]glutamate release was determined. Values are mean ± S.E.M. of samples from 3 different animals performed in 4 replicates. Drug effects were assessed by comparing the relative area under the curve for each condition. The IC50 values were: 25.25 nM (C.I.: 9.63–66.20 nM) for dopamine alone, 5.75 nM (2.12–15 nM) for dopamine in the presence of L-741,626 and 357.27 nM (C.I.: 73.40–1739 nM) for dopamine in the presence of L 745,870. In (c) slices were treated for 32 min with increasing concentrations of RO 10-5824 in the absence (black circles) or in the presence (open circles) of quinelorane (10 nM) and K+ stimulated [3H]glutamate release was determined. In (d) slices were treated for 32 min with increasing concentrations of quinelorane in the absence (black circles) or in the presence (open circles) of RO 10-5824 (10 nM) and K+ stimulated [3H]glutamate release was determined. In (c) and (d), values are mean ± S.E.M. of samples from 3 different animals performed in 4 replicates. The IC50 values were: (c) 15 nM (35.15-6.55 nM) for RO 10-5824 alone and 0.05 nM (1.21-0.02 nM) for RO 10-5824 in the presence of quinelorane (Student’s t test: p<0.01) and (d) 2.55 nM (7.31-0.89 nM) for quinelorane alone and 1.48 nM (4.5-0.45 nM) for quinelorane in the presence of RO 10-5824 (Student’s t test; NS).

References

    1. Lauzon NM, Laviolette SR. Dopamine D4-receptor modulation of cortical neuronal network activity and emotional processing: Implications for neuropsychiatric disorders. Behav Brain Res. 2010;208:12–22. - PubMed
    1. Tarazi FI, Campbell A, Yeghiayan SK, Baldessarini RJ. Localization of dopamine receptor subtypes in corpus striatum and nucleus accumbens septi of rat brain: comparison of D1-, D2-, and D4-like receptors. Neuroscience. 1998;83:169–176. - PubMed
    1. Svingos AL, Periasamy S, Pickel VM. Presynaptic dopamine D(4) receptor localization in the rat nucleus accumbens shell. Synapse. 2000;36:222–232. - PubMed
    1. LaHoste GJ, Swanson JM, Wigal SB, Glabe C, Wigal T, King N, et al. Dopamine D4 receptor gene polymorphism is associated with attention deficit hyperactivity disorder. Mol Psychiatry. 1996;1:121–124. - PubMed
    1. Swanson JM, Kinsbourne M, Nigg J, Lanphear B, Stefanos GA, Volkow N, et al. Etiologic subtypes of attention-deficit/hyperactivity disorder: barin imaging, molecular genetics and environmental factors and the dopamine hypothesis. Neuropsychol Rev. 2007;17:39–59. - PubMed

Publication types