. 2012 Jan;22(1):178-93.
doi: 10.1038/cr.2011.133. Epub 2011 Aug 16.

Defining the nature of human pluripotent stem cell progeny

Affiliations

Defining the nature of human pluripotent stem cell progeny

Michaela Patterson et al. Cell Res. 2012 Jan.

Abstract

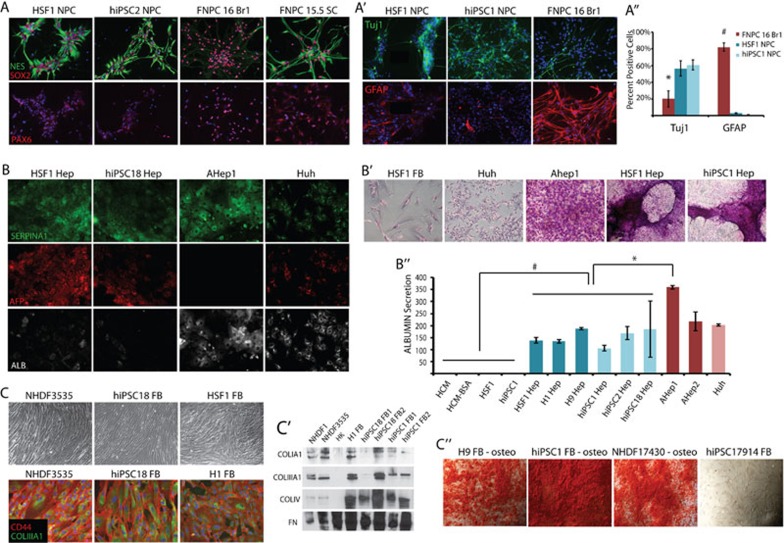
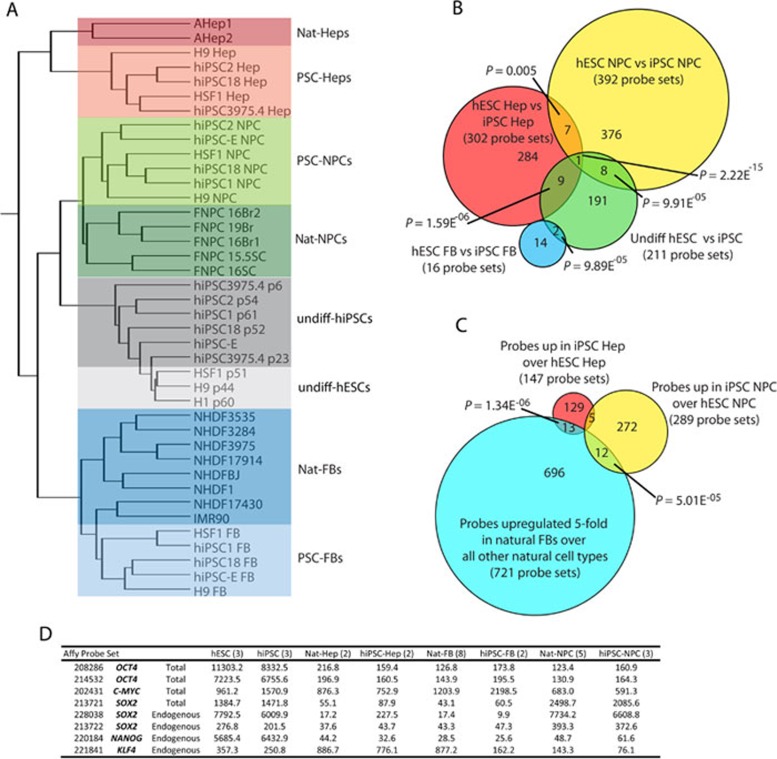
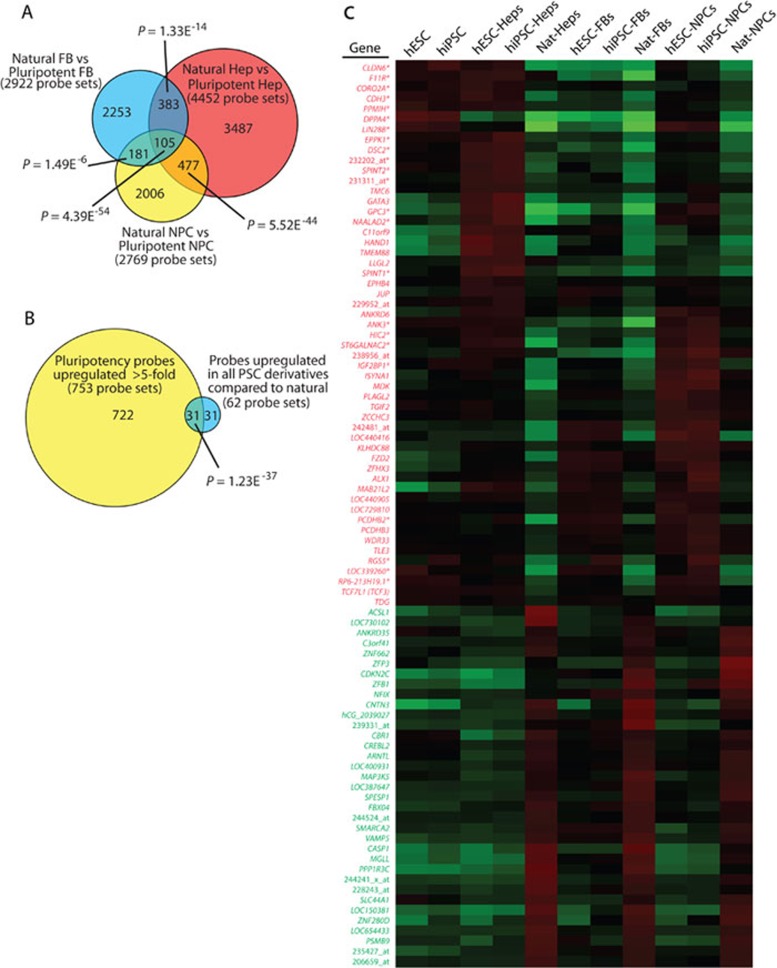
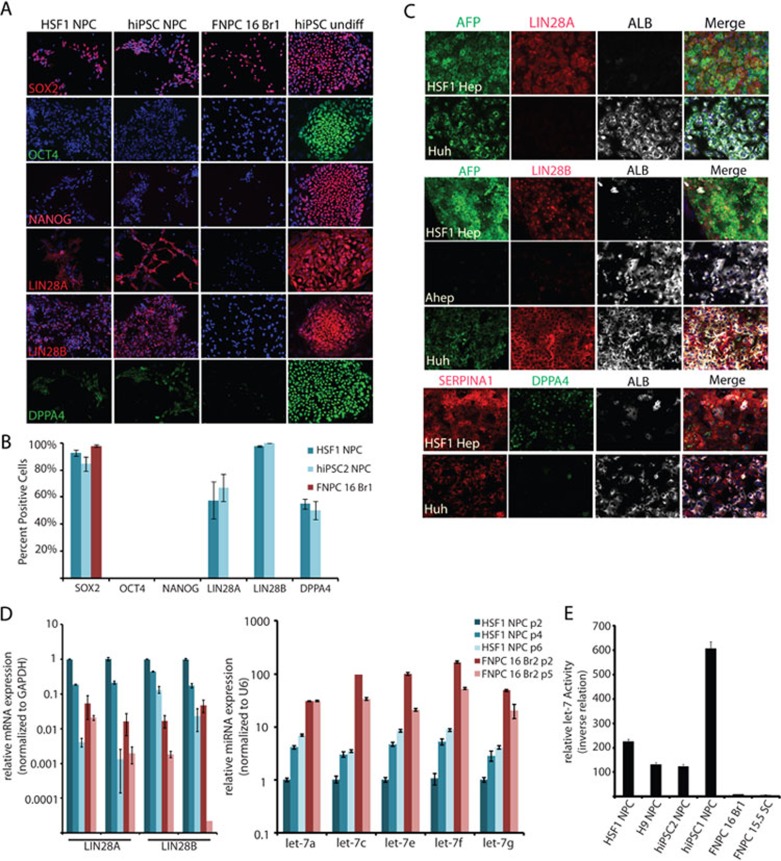
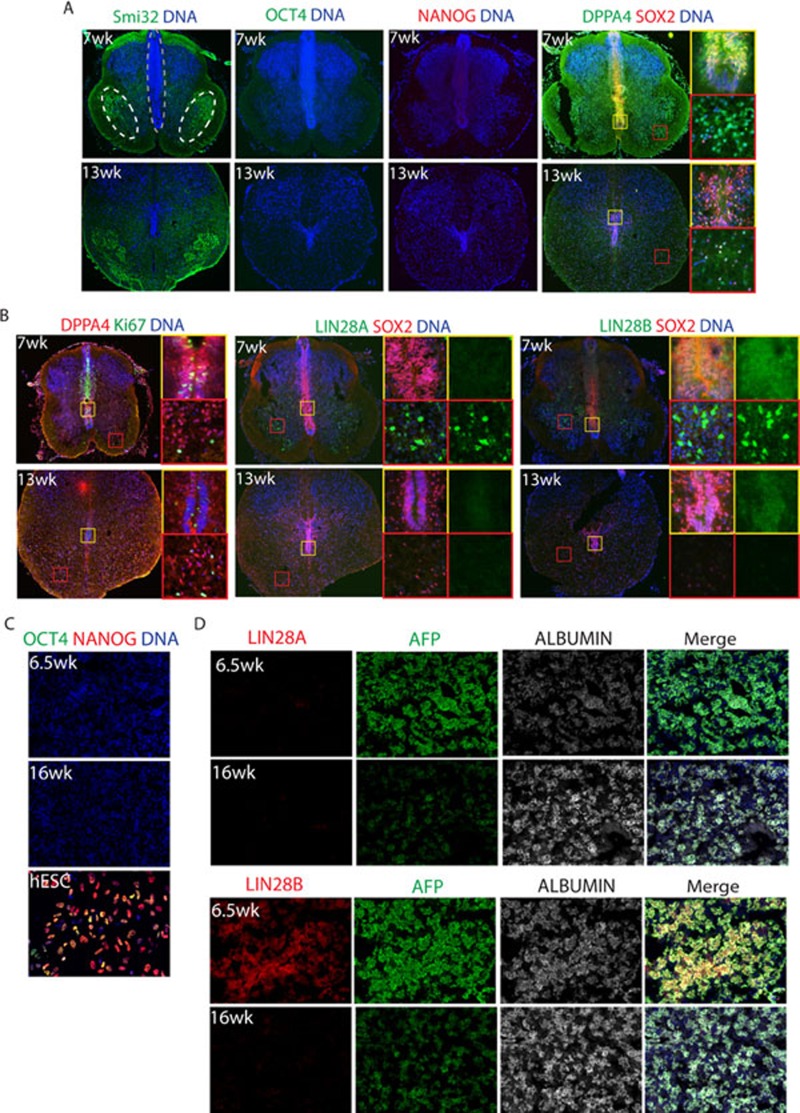
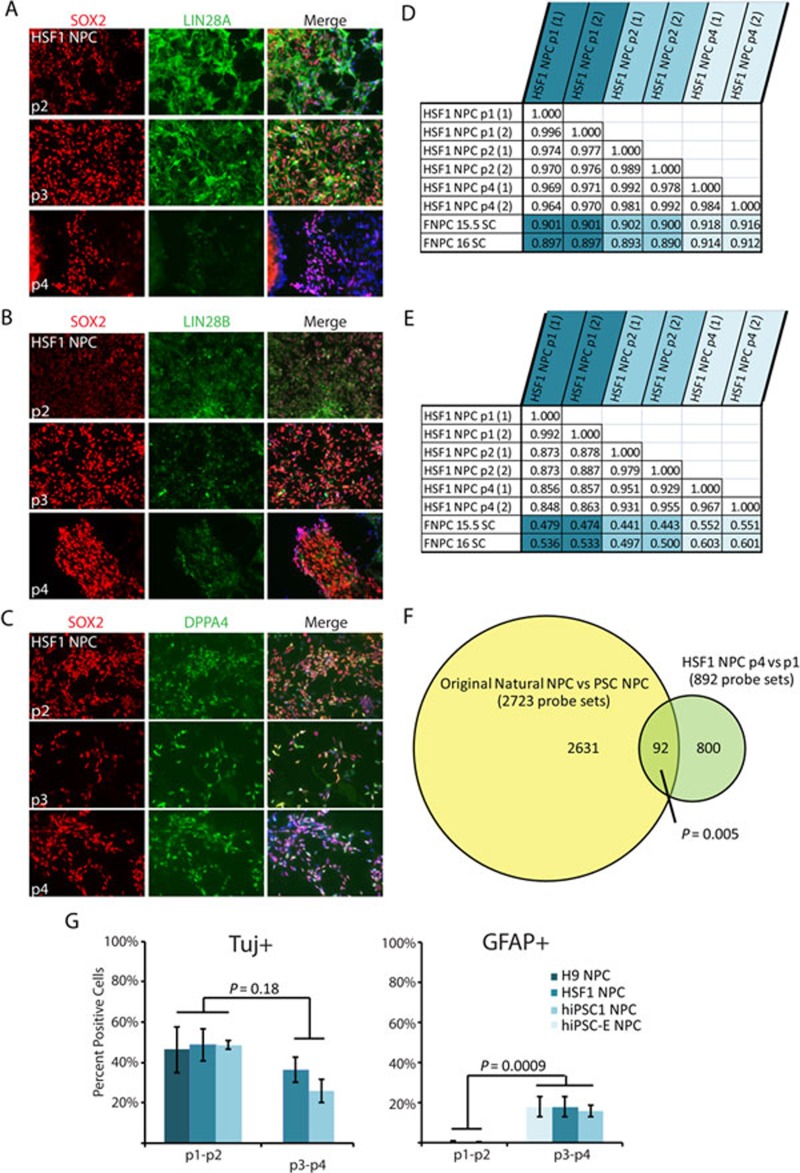
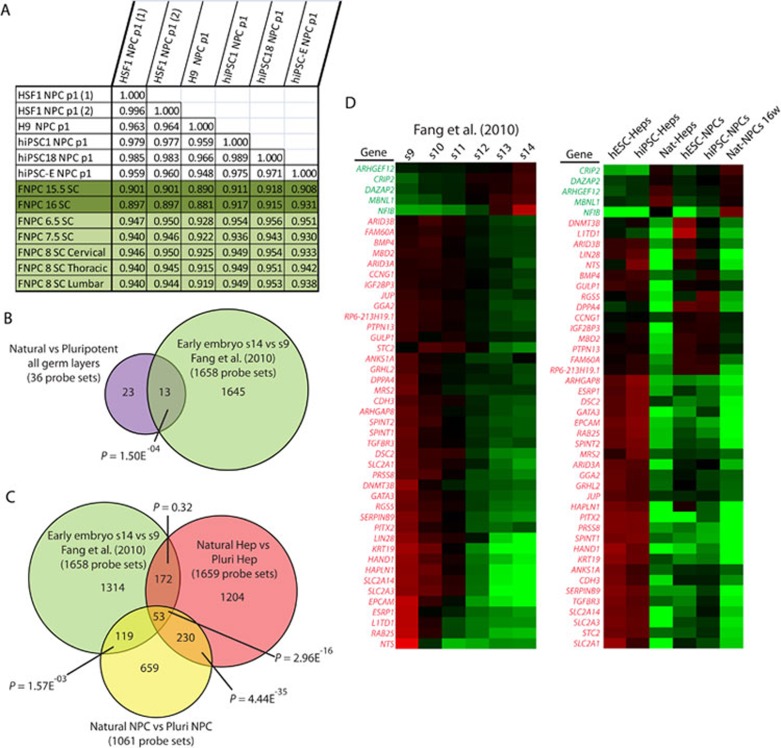
While it is clear that human pluripotent stem cells (hPSCs) can differentiate to generate a panoply of various cell types, it is unknown how closely in vitro development mirrors that which occurs in vivo. To determine whether human embryonic stem cells (hESCs) and human-induced pluripotent stem cells (hiPSCs) make equivalent progeny, and whether either makes cells that are analogous to tissue-derived cells, we performed comprehensive transcriptome profiling of purified PSC derivatives and their tissue-derived counterparts. Expression profiling demonstrated that hESCs and hiPSCs make nearly identical progeny for the neural, hepatic, and mesenchymal lineages, and an absence of re-expression from exogenous reprogramming factors in hiPSC progeny. However, when compared to a tissue-derived counterpart, the progeny of both hESCs and hiPSCs maintained expression of a subset of genes normally associated with early mammalian development, regardless of the type of cell generated. While pluripotent genes (OCT4, SOX2, REX1, and NANOG) appeared to be silenced immediately upon differentiation from hPSCs, genes normally unique to early embryos (LIN28A, LIN28B, DPPA4, and others) were not fully silenced in hPSC derivatives. These data and evidence from expression patterns in early human fetal tissue (3-16 weeks of development) suggest that the differentiated progeny of hPSCs are reflective of very early human development (< 6 weeks). These findings provide support for the idea that hPSCs can serve as useful in vitro models of early human development, but also raise important issues for disease modeling and the clinical application of hPSC derivatives.


Figures

Figure 1
Figure 1
hESC and hiPSC lines make cell types representing all three germ layers. hESC and hiPSC lines were directed to differentiate into either NPCs (A), hepatocytes (B), or fibroblasts (C). (A) Immunofluorescence staining for SOX2 (red, top panel), NESTIN (green, top panel), and DNA (blue) and PAX6 (red, bottom panel). (A′) Immunofluorescence staining demonstrating that NPCs derived from hESCs, hiPSC, or natural sources could be differentiated into Tuj1+ neurons (green) and GFAP+ glia (red). (A″) Quantification of the percent of cells undergoing neuronal (Tuj1+) or glial (GFAP+) differentiation. Error bars represent standard error over 5-8 fields of view. *P < 0.05; #P < 1.0E−06. (B) Immunofluorescence staining of SERPINA1 (green), AFP (red), ALBUMIN (white), and DNA (blue). (B′) Periodic acid-schiff assay stain demonstrating glycogen storage in natural- and pluripotent-derived hepatocytes. (B″) ELISA measuring albumin secretion on confluent plates. Error bars represent standard error over two replicates. *P < 0.01; #P < 0.05. (C) Top, phase-contrast images of fusiform morphology displayed by pluripotent- and naturally derived fibroblasts. (C) Bottom, immunofluorescence staining of CD44 (red), COLIIIA1 (green), and DNA (blue). (C′) Western blot for secreted collagen proteins (COLIA1, COLIIIA1, and COLIV) and FIBRONECTIN (FN). HK, human keratinocyte. (C″) Alizarin Red stain following further differentiation of pluripotent cell- and tissue-derived fibroblasts down the osteogenic lineage.
Figure 2
Figure 2
Global gene expression analysis. (A) Hierarchical clustering analysis of global gene expression in undifferentiated hESCs, hiPSC, and their progeny compared to naturally derived cells. (B) Venn diagram summarizing the probe sets that were differentially expressed (t-test P < 0.01; fold change ≥1.54) between the progeny of hiPSCs versus the progeny of hESCs for each germ layer and the undifferentiated. (C) Venn diagram overlapping fibroblast signature probe sets (t-test between natural-FB and all other natural cell types; upregulated in FBs ≥5.0) with probe sets upregulated in iPSC progeny over ESC progeny for the NPC and Hep lineages. P-Values from B and C were measured by hypergeometric distribution or simulation as in . (D) Normalized values from microarray probe sets for the reprogramming factors used to make the hiPSCs used in this study.
Figure 3
Figure 3
Expression profiling identifies a conserved list of probe sets differentially expressed between pluripotent derivatives and their natural counterparts. (A) A t-test (P < 0.01) was performed to identify probe sets differentially expressed between PSC derivatives (FB, blue; Hep, red; NPC, yellow) and their respective natural counterparts (fold change ≥ 1.54). Venn diagram reveals the overlap of these differences across the different progeny. (B) Overlap of the 62 probe sets specifically upregulated in 3A with probe sets that demonstrate a significant difference between pluripotent cells and naturally derived somatic cells (fold upregulation ≥ 5). P-Values from A and B measured by hypergeometric distribution or simulation as in . (C) A heat map was generated for the 88 unique genes or ESTs represented by the 105 probe sets shown in A that are differentially expressed between PSC derivatives and tissue derived cells. Note that signal shown represents value divided by the average of all samples and genes in red were consistently found upregulated in PSC progeny versus tissue-derived cells, while those in green were always downregulated. *Indicates genes expressed highly in the pluripotent stem cells (identified in B).
Figure 4
Figure 4
Expression and activity of LIN28 and DPPA4 in PSC derivatives. (A) NPCs made from PSCs and brain were stained with pluripotency markers SOX2, OCT4, NANOG, LIN28A, LIN28B, and DPPA4. Undifferentiated hiPSCs were stained as a positive control for the pluripotency markers. (B) Quantification of the percent of FNPCs and PSC-NPCs expressing the indicated pluripotency markers. (C) HSF1-derived hepatocytes and control cells were immunostained with antibodies recognizing ALBUMIN, AFP, or SERPINA1 to highlight both immature and mature cells and either LIN28A, LIN28B, and DPPA4 to demonstrate that these pluripotency factors are not silenced immediately upon differentiation. Hepatocytes taken from adult human liver did not express any of these pluripotency genes, while Huh, a hepatocarcinoma cell line expressed LIN28B. (D) Real-time PCR for LIN28A and LIN28B mRNA (left) and let-7 miRNA family members (right). mRNA expression was normalized to GAPDH, while miRNA expression was normalized to U6. Error bars represent standard error over three or four replicates. (E) To determine the relative let-7 activity in the indicated cell types, each was transfected with let-7 reporter and constitutive reporter as a transfection control. Dual luciferase assays were performed 48 h after transfection in triplicate. Assay shown was representative of three independent experiments.
Figure 5
Figure 5
Differentially expressed genes, DPPA4, LIN28A, and LIN28B are found in early fetal tissues. (A) Spinal cord tissues (7- and 13-week-old) were fixed, sectioned, and stained with the indicated markers. Smi32 was used to highlight the motor neuron pool (white circles). SOX2 labels the NPCs found along the midline (grey outline). (B) DPPA4 co-localized with proliferation marker Ki67 along the midline (yellow inset) at 7 weeks, but not in the dispersed lateral stain (red inset). At 13 weeks, DPPA4 was more dispersed and the number of Ki67-positive cells was decreased. LIN28A had a cytosolic staining pattern and was located in cells outside of the midline (red and yellow insets) at 7 weeks, but absent at 13 weeks. LIN28B had a nuclear staining pattern at 7 weeks. It was often co-localized with SOX2 along the midline at 7 weeks and was weaker at 13 weeks (yellow inset). (C) Fetal liver (6.5- and 16-weeks-old) were stained with the indicated pluripotency markers, showing the complete silencing of pluripotency genes. hESCs were used as a positive control. (D) Fetal liver (6.5- and 16-week-old) were stained with LIN28A, LIN28B, and the indicated liver markers.
Figure 6
Figure 6
Continued passaging of PSC-NPCs reduces LIN28 expression and corrects a small portion of the gene expression discrepancies. (A-C) Immunofluorescence staining of HSF1-derived NPCs over four passages. Each passage represents ∼5-7 days in culture. (D) Pearson correlation comparing global gene expression between HSF1 NPCs over several passages and NPCs derived from 16-week-old fetal spinal cord. (E) Pearson correlation including only those probe sets identified as different between PSC-NPC and Nat-NPCs (analysis from Figure 3A). (F) Venn diagram demonstrating the original differences identified in Figure 3A overlap significantly with gene expression differences between p1 and p4 PSC-NPCs (t-test P < 0.01; fold change ≥ 1.54). Direction of differential expression was taken into account. Statistical analysis performed by hypergeometric distribution. Note: later analyses were performed by normalizing and filtering only samples of the neural lineage. As a result the original 2 769 probe sets identified by analysis in Figure 3A were reduced to 2 723. (G) Percent of PSC-NPCs at the indicated passage undergoing neuronal (Tuj1) or glial (GFAP) differentiation following 3 weeks of differentiation.
Figure 7
Figure 7
Evidence that PSC derivatives reflect cell types found prior to 6 weeks of development. (A) Pearson correlation comparing global gene expression between PSC-NPCs and fetal spinal cord NPCs. (B) Comparison of the original probe sets identified as different between PSC derivatives and their natural counterpart (Figure 3A) and those differentially expressed between stage 9 and stage 14 embryos (Fang et al. , t-test P < 0.01, fold change ≥ 1.54). (C) Venn diagram comparing the probe sets different between PSC derivatives and their tissue-derived counterparts for the Hep and NPC lineages and those differentially expressed between stage 9 and stage 14 embryos. (D) Heat maps generated for the 46 unique genes represented by the 53 probe sets shown in C. Left, samples include the six stages of embryonic development represented in Fang et al. . Right, samples include PSC-derived NPCs and Heps and their respective natural counterparts. Green probe sets represent those genes upregulated over the course of development, while red probe sets are those downregulated over the course of development.

Similar articles

Cited by

References

    1. Takahashi K, Tanabe K, Ohnuki M, et al. Induction of pluripotent stem cells from adult human fibroblasts by defined factors. Cell. 2007;131:861–872. - PubMed
    1. Chin MH, Mason MJ, Xie W, et al. Induced pluripotent stem cells and embryonic stem cells are distinguished by gene expression signatures. Cell Stem Cell. 2009;5:111–123. - PMC - PubMed
    1. Ghosh Z, Wilson KD, Wu Y, Hu S, Quertermous T, Wu JC. Persistent donor cell gene expression among human induced pluripotent stem cells contributes to differences with human embryonic stem cells. PLoS ONE. 2010;5:e8975. - PMC - PubMed
    1. Marchetto MC, Yeo GW, Kainohana O, Marsala M, Gage FH, Muotri AR. Transcriptional signature and memory retention of human-induced pluripotent stem cells. PLoS ONE. 2009;4:e7076. - PMC - PubMed
    1. Bock C, Kiskinis E, Verstappen G, et al. Reference maps of human ES and iPS cell variation enable high-throughput characterization of pluripotent cell lines. Cell. 2011;144:439–452. - PMC - PubMed

Publication types

MeSH terms