. 2011 Sep 29;115(38):11261-8.
doi: 10.1021/jp2049266. Epub 2011 Aug 31.

Quantitative characterization of temperature-independent and temperature-dependent protein-protein interactions in highly nonideal solutions

Affiliations

Quantitative characterization of temperature-independent and temperature-dependent protein-protein interactions in highly nonideal solutions

Adedayo A Fodeke et al. J Phys Chem B. .

Abstract

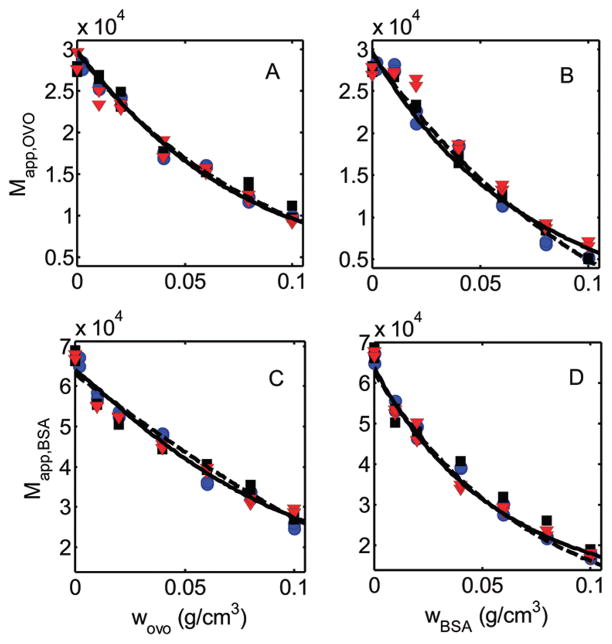
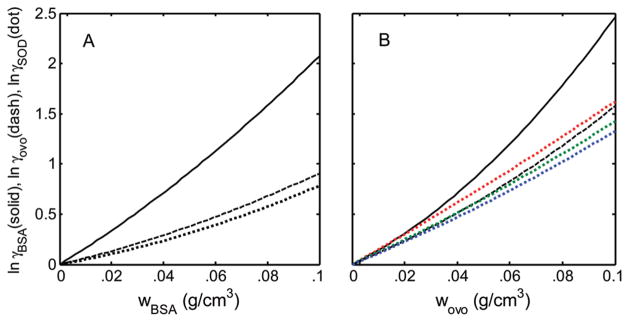
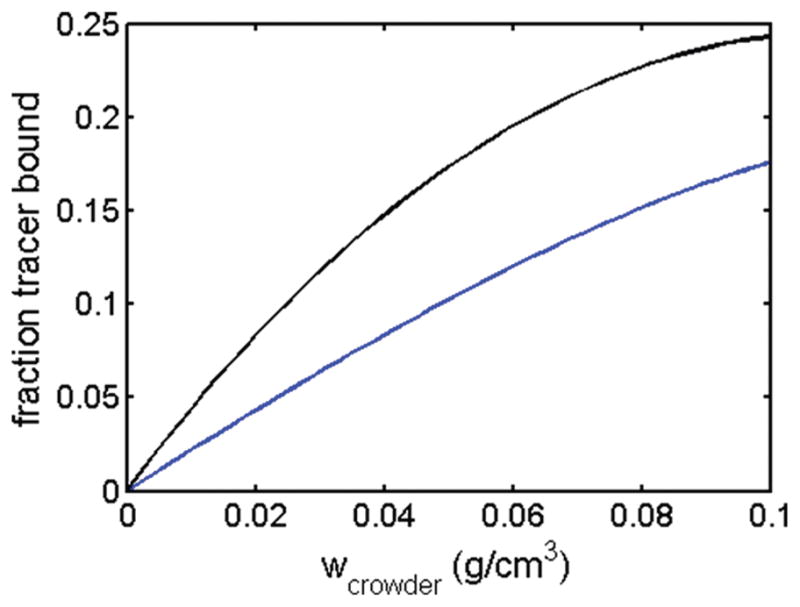
The interaction among each of three dilute "tracer" proteins (bovine serum albumin, superoxide dismutase, and ovomucoid) at a concentration of 2 mg/mL and each of two "crowder" proteins (ovomucoid and BSA) at concentrations up to 100 mg/mL was characterized by analysis of dependence of the equilibrium gradients of both tracer and crowder upon the concentration of crowder. The equilibrium gradients of both crowder proteins were found to be independent of temperature over the range 5-37 °C. The equilibrium gradients of tracer BSA and ovomucoid in the complementary crowder species were likewise found to be independent of temperature over this range, indicating that interaction among these tracers and crowders is predominantly repulsive and essentially entirely entropic in nature. The equilibrium gradient of tracer SOD in BSA was also found to be independent of temperature over this range, but the gradient of tracer SOD in ovomucoid depended significantly upon temperature in a manner indicating a significant enthalpic (attractive) component of the overall interaction between SOD and ovomucoid. The experimental data are analyzed using model-free expansions of the thermodynamic activity coefficients of tracer and crowder in powers of the concentration of crowder and using approximate statistical thermodynamic models based upon highly simplified descriptions of molecular structure and interactions. Detailed analysis of the results indicates a relatively small contribution of nonspecific attraction to the total protein-protein interaction, which is dominated by steric repulsion.


Figures

Figure 1
Figure 1
Apparent molar masses of tracer FITC–ovomucoid and FITC–BSA as functions of the w/v concentration of unlabeled ovomucoid and BSA. Data: red triangles, −37 °C; black squares, −25 °C; blue circles −5 °C. Solid curves are calculated using eqs 2 (panels A, D) or 3 (panels B, C) with w1(d ln γi/dw1) calculated using virial expansion eq 8 with the corresponding best-fit parameter values given in Table 1. Dashed curves are calculated using effective HS model 3 eqs 2 (panels A, D) or 5 and 12 (panels B, C) where w1(d ln γi/dw1) is calculated using eq 11 with the corresponding best-fit parameter values given in Table 1.
Figure 2
Figure 2
Apparent molar masses of tracer FITC–SOD as a functions of the w/v concentration of BSA (panel A) and ovomucoid (panel B). Colors and symbols of data points as in Figure 1. Solid curves in panels A and B are calculated using eq 3 with w1(d ln γi/dw1) calculated using virial expansion eq 8 with the corresponding best-fit parameter values given in Tables 2 and 3, respectively. Dashed curve in panel A calculated using effective HS model 3 eqs 5 and 12 with w1(d ln γi/dw) calculated using eq 11 with the corresponding best-fit parameter values given in Table 2. Dashed curves in panel B are calculated using effective HS model 4B eqs 5, 12, and 13, where w1(d ln γi/dw) is calculated using eq 11 with the corresponding best-fit parameter values given in Table 3.
Figure 3
Figure 3
Calculated dependence of lnγi=μiexcess/RT of tracer proteins upon the concentration of crowder proteins. All curves were calculated using eq 7 with the appropriate best-fit values of the corresponding virial coefficients given in Tables 1–3. Tracer species are BSA (solid curves), ovomucoid (dashed curves), and SOD (dotted curves). Results obtained for tracer SOD in ovomucoid at 37, 25, and 5 °Care plotted in red, green, and blue, respectively.
Figure 4
Figure 4
Fraction of tracer bound to crowder in mixtures of ovomucoid and BSA as a function of crowder concentration, calculated using best-fit parameters for effective HS model 3 presented in Table 1. Blue curve, trace BSA in ovomucoid crowder. Black curve, trace ovomucoid in BSA crowder.
Figure 5
Figure 5
Estimates of the temperature dependence of the equilibrium constant for apparent “binding” of trace SOD to ovomucoid. Points: best-fit values obtained by fitting effective HS model 4A to the combined data at three temperatures. Line: dependence calculated using eq 13 with best-fit values of ΔH120/R and ΔS120/R obtained by fitting effective HS model 4B to the combined data.

Similar articles

Cited by

References

    1. Minton AP. Mol Cell Biochem. 1983;55:119–140. - PubMed
    1. Zhou HX, Rivas G, Minton AP. Ann Rev Biophys. 2008;37:375–397. - PMC - PubMed
    1. Zimmerman SB, Minton AP. Annu Rev Biophys Biomol Struct. 1993;22:27–65. - PubMed
    1. Douglas JF, Dudowicz J, Freed KF. Phys Rev Lett. 2009;103:135701. - PubMed
    1. Jiao M, Li HT, Chen J, Minton AP, Liang Y. Biophys J. 2010;99:914–923. - PMC - PubMed

Publication types