

Prediction of conformational B-cell epitopes from 3D structures by random forests with a distance-based feature
- PMID: 21846404
- PMCID: PMC3228550
- DOI: 10.1186/1471-2105-12-341
Prediction of conformational B-cell epitopes from 3D structures by random forests with a distance-based feature
Abstract
Background: Antigen-antibody interactions are key events in immune system, which provide important clues to the immune processes and responses. In Antigen-antibody interactions, the specific sites on the antigens that are directly bound by the B-cell produced antibodies are well known as B-cell epitopes. The identification of epitopes is a hot topic in bioinformatics because of their potential use in the epitope-based drug design. Although most B-cell epitopes are discontinuous (or conformational), insufficient effort has been put into the conformational epitope prediction, and the performance of existing methods is far from satisfaction.
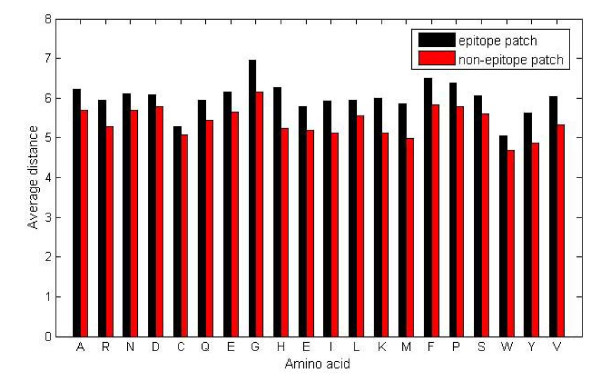
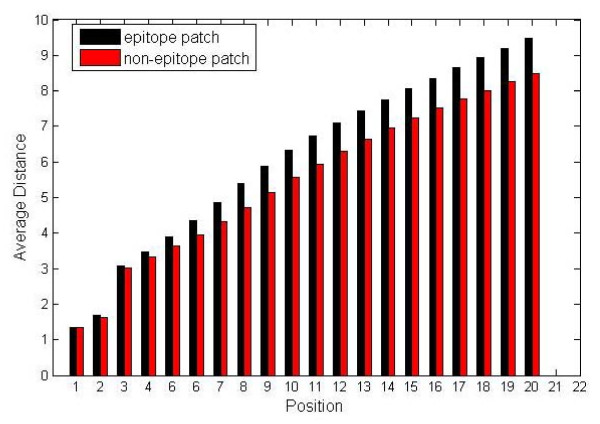
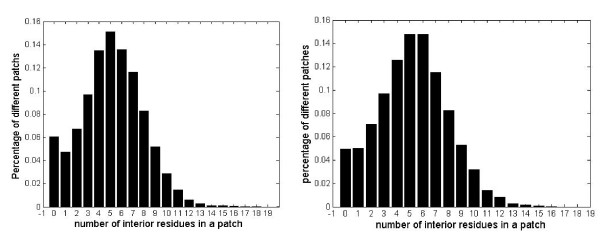
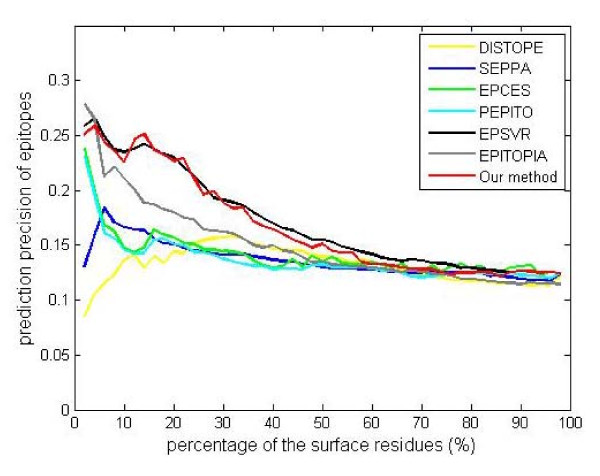
Results: In order to develop the high-accuracy model, we focus on some possible aspects concerning the prediction performance, including the impact of interior residues, different contributions of adjacent residues, and the imbalanced data which contain much more non-epitope residues than epitope residues. In order to address above issues, we take following strategies. Firstly, a concept of 'thick surface patch' instead of 'surface patch' is introduced to describe the local spatial context of each surface residue, which considers the impact of interior residue. The comparison between the thick surface patch and the surface patch shows that interior residues contribute to the recognition of epitopes. Secondly, statistical significance of the distance distribution difference between non-epitope patches and epitope patches is observed, thus an adjacent residue distance feature is presented, which reflects the unequal contributions of adjacent residues to the location of binding sites. Thirdly, a bootstrapping and voting procedure is adopted to deal with the imbalanced dataset. Based on the above ideas, we propose a new method to identify the B-cell conformational epitopes from 3D structures by combining conventional features and the proposed feature, and the random forest (RF) algorithm is used as the classification engine. The experiments show that our method can predict conformational B-cell epitopes with high accuracy. Evaluated by leave-one-out cross validation (LOOCV), our method achieves the mean AUC value of 0.633 for the benchmark bound dataset, and the mean AUC value of 0.654 for the benchmark unbound dataset. When compared with the state-of-the-art prediction models in the independent test, our method demonstrates comparable or better performance.
Conclusions: Our method is demonstrated to be effective for the prediction of conformational epitopes. Based on the study, we develop a tool to predict the conformational epitopes from 3D structures, available at http://code.google.com/p/my-project-bpredictor/downloads/list.
Figures
Similar articles
-
Computational prediction of conformational B-cell epitopes from antigen primary structures by ensemble learning.PLoS One. 2012;7(8):e43575. doi: 10.1371/journal.pone.0043575. Epub 2012 Aug 21. PLoS One. 2012. PMID: 22927994 Free PMC article.
-
An ensemble method for prediction of conformational B-cell epitopes from antigen sequences.Comput Biol Chem. 2014 Apr;49:51-8. doi: 10.1016/j.compbiolchem.2014.02.002. Epub 2014 Feb 18. Comput Biol Chem. 2014. PMID: 24607818
-
Conformational B-cell epitopes prediction from sequences using cost-sensitive ensemble classifiers and spatial clustering.Biomed Res Int. 2014;2014:689219. doi: 10.1155/2014/689219. Epub 2014 Jun 17. Biomed Res Int. 2014. PMID: 25045691 Free PMC article.
-
Bioinformatics resources and tools for conformational B-cell epitope prediction.Comput Math Methods Med. 2013;2013:943636. doi: 10.1155/2013/943636. Epub 2013 Jul 21. Comput Math Methods Med. 2013. PMID: 23970944 Free PMC article. Review.
-
Computational Methods to Predict Conformational B-Cell Epitopes.Biomolecules. 2024 Aug 10;14(8):983. doi: 10.3390/biom14080983. Biomolecules. 2024. PMID: 39199371 Free PMC article. Review.
Cited by
-
Immunization with a novel chimeric peptide representing B and T cell epitopes from HER2 extracellular domain (HER2 ECD) for breast cancer.Tumour Biol. 2014 Dec;35(12):12049-57. doi: 10.1007/s13277-014-2503-y. Epub 2014 Aug 21. Tumour Biol. 2014. PMID: 25142233
-
Exploiting a reduced set of weighted average features to improve prediction of DNA-binding residues from 3D structures.PLoS One. 2011;6(12):e28440. doi: 10.1371/journal.pone.0028440. Epub 2011 Dec 8. PLoS One. 2011. PMID: 22174808 Free PMC article.
-
Deep learning of antibody epitopes using positional permutation vectors.Comput Struct Biotechnol J. 2024 Jun 15;23:2695-2707. doi: 10.1016/j.csbj.2024.06.005. eCollection 2024 Dec. Comput Struct Biotechnol J. 2024. PMID: 39035832 Free PMC article.
-
Accurate prediction of immunogenic T-cell epitopes from epitope sequences using the genetic algorithm-based ensemble learning.PLoS One. 2015 May 28;10(5):e0128194. doi: 10.1371/journal.pone.0128194. eCollection 2015. PLoS One. 2015. PMID: 26020952 Free PMC article.
-
DeepLBCEPred: A Bi-LSTM and multi-scale CNN-based deep learning method for predicting linear B-cell epitopes.Front Microbiol. 2023 Feb 22;14:1117027. doi: 10.3389/fmicb.2023.1117027. eCollection 2023. Front Microbiol. 2023. PMID: 36910218 Free PMC article.
References
-
- Van Regenmortel MH. Pitfalls of reductionism in the design of peptide-cased vaccines. Vaccine. 2004;19:2369–2374. - PubMed
-
- Flower DR. Immunoinformatics: Predicting Immunogenicity in silico. 1. Humana: Totowa, NJ; 2007. - PubMed
-
- Karplus PA, Schulz GE. Prediction of chain flexibility in proteins-a tool for the selection of peptide antigens. Naturwissenschaften. 1985;72:212–213. doi: 10.1007/BF01195768. - DOI
Publication types
MeSH terms
Substances
LinkOut - more resources
Full Text Sources
Other Literature Sources
