. 2011 Oct 7;286(40):34959-75.
doi: 10.1074/jbc.M110.187666. Epub 2011 Aug 16.

Liver-specific inducible nitric-oxide synthase expression is sufficient to cause hepatic insulin resistance and mild hyperglycemia in mice

Affiliations

Liver-specific inducible nitric-oxide synthase expression is sufficient to cause hepatic insulin resistance and mild hyperglycemia in mice

Shohei Shinozaki et al. J Biol Chem. .

Erratum in

  • J Biol Chem. 2011 Nov 11;286(45):39673. Shiota, Goshi [added]

Abstract

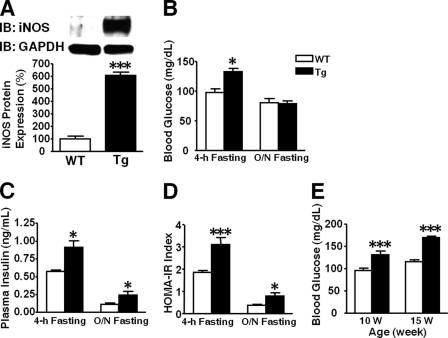
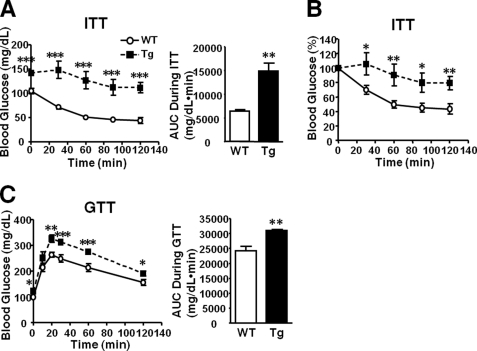
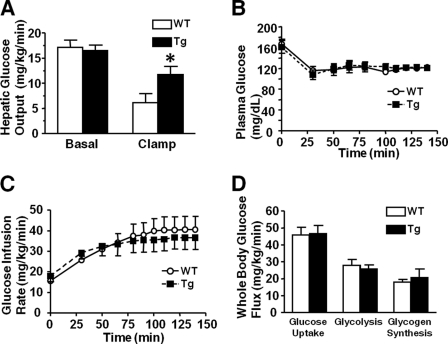
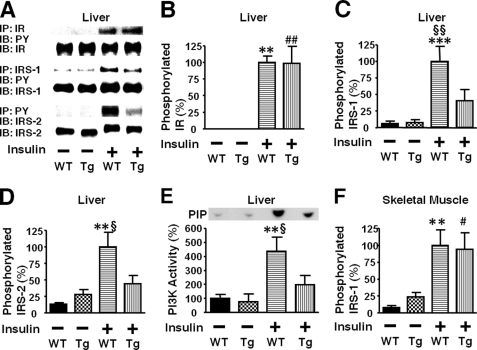
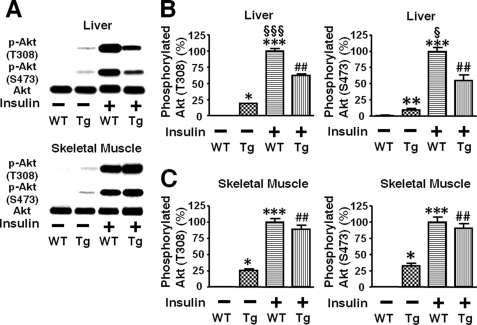
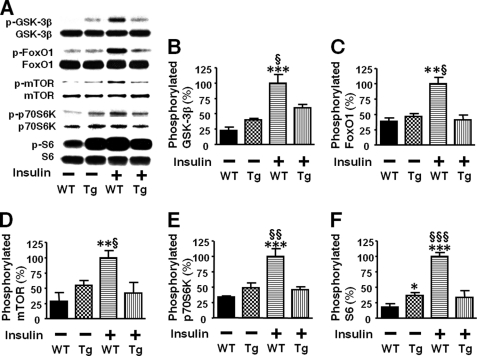
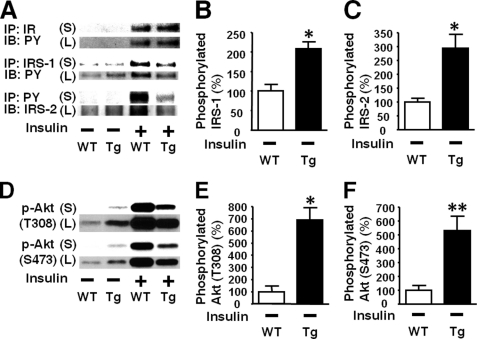
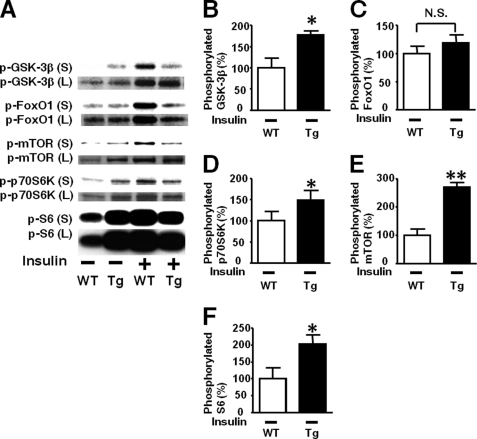
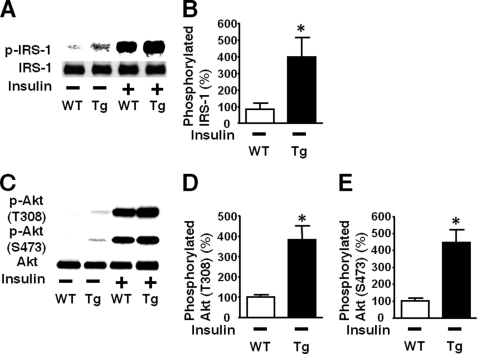
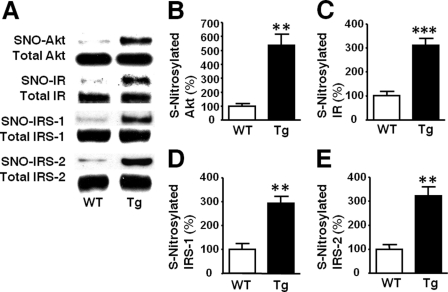
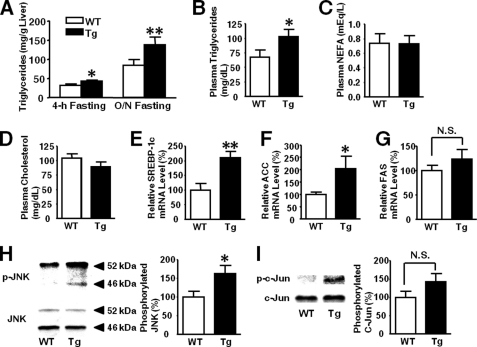
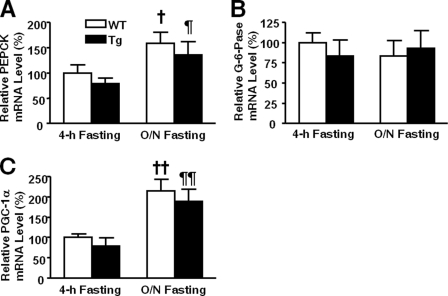
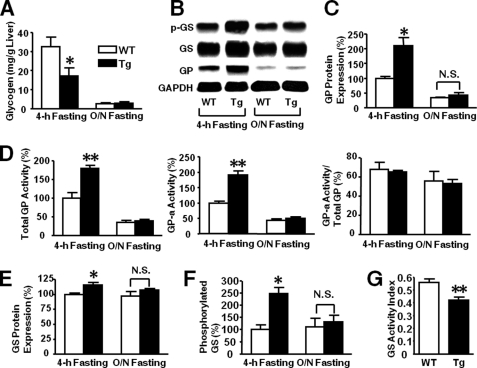
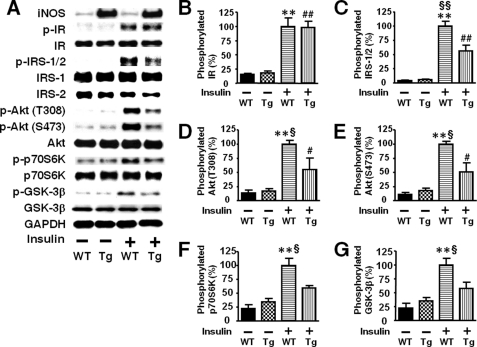
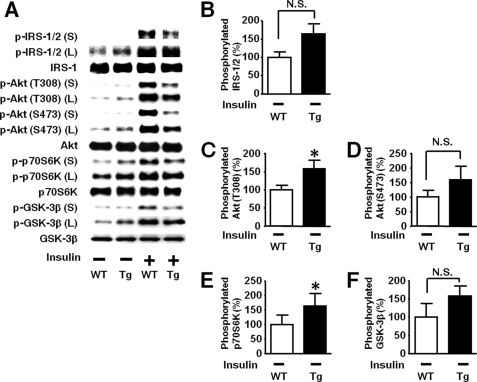
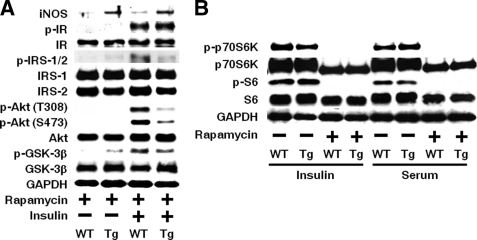
Inducible nitric-oxide synthase (iNOS), a major mediator of inflammation, plays an important role in obesity-induced insulin resistance. Inhibition of iNOS by gene disruption or pharmacological inhibitors reverses or ameliorates obesity-induced insulin resistance in skeletal muscle and liver in mice. It is unknown, however, whether increased expression of iNOS is sufficient to cause insulin resistance in vivo. To address this issue, we generated liver-specific iNOS transgenic (L-iNOS-Tg) mice, where expression of the transgene, iNOS, is regulated under mouse albumin promoter. L-iNOS-Tg mice exhibited mild hyperglycemia, hyperinsulinemia, insulin resistance, and impaired insulin-induced suppression of hepatic glucose output, as compared with wild type (WT) littermates. Insulin-stimulated phosphorylation of insulin receptor substrate-1 (IRS-1) and -2, and Akt was significantly attenuated in liver, but not in skeletal muscle, of L-iNOS-Tg mice relative to WT mice without changes in insulin receptor phosphorylation. Moreover, liver-specific iNOS expression abrogated insulin-stimulated phosphorylation of glycogen synthase kinase-3β, forkhead box O1, and mTOR (mammalian target of rapamycin), endogenous substrates of Akt, along with increased S-nitrosylation of Akt relative to WT mice. However, the expression of insulin receptor, IRS-1, IRS-2, Akt, glycogen synthase kinase-3β, forkhead box O1, protein-tyrosine phosphatase-1B, PTEN (phosphatase and tensin homolog), and p85 phosphatidylinositol 3-kinase was not altered by iNOS transgene. Hyperglycemia was associated with elevated glycogen phosphorylase activity and decreased glycogen synthase activity in the liver of L-iNOS-Tg mice, whereas phosphoenolpyruvate carboxykinase, glucose-6-phosphatase, and proliferator-activated receptor γ coactivator-1α expression were not altered. These results clearly indicate that selective expression of iNOS in liver causes hepatic insulin resistance along with deranged insulin signaling, leading to hyperglycemia and hyperinsulinemia. Our data highlight a critical role for iNOS in the development of hepatic insulin resistance and hyperglycemia.


Figures

FIGURE 1.
FIGURE 1.
Hyperglycemia and hyperinsulinemia in L-iNOS-Tg mice. Immunoblot analysis (IB) showed that iNOS expression was increased in liver of L-iNOS-Tg mice compared with WT mice (A). Blood samples were collected after 4-h and overnight (O/N) fasting at 8 and 10 weeks of age, respectively. Blood glucose levels were significantly greater in L-iNOS-Tg mice than WT mice after 4-h, but not overnight, fasting (B). Plasma insulin concentrations were significantly greater in L-iNOS-Tg mice than WT mice after both 4-h and overnight fasting (C). Consistently, L-iNOS-Tg mice exhibited insulin resistance, as indicated by elevated HOMA insulin resistance index (D). Hyperglycemia after 4 h of fasting was observed in L-iNOS-Tg mice at 10 and 15 weeks of age as well (E). n = 7–9 per group. *, p < 0.05; ***, p < 0.005 versus WT.
FIGURE 2.
FIGURE 2.
Insulin resistance and glucose intolerance in L-iNOS-Tg mice. A and B, an insulin tolerance test (ITT) revealed significantly attenuated hypoglycemic response to insulin injection (0.65 units/kg of body weight, intraperitoneal injection) in L-iNOS-Tg mice compared with WT littermates. The area under the curve (AUC) analysis showed increased blood glucose levels in L-iNOS-Tg mice during the insulin tolerance test. n = 5–8 per group. C, glucose tolerance tests (GTT, 1.5 g/kg of body weight, intraperitoneal injection) demonstrated glucose intolerance in L-iNOS-Tg mice compared with WT littermates. The area under the glucose curve was calculated during GTT. n = 8 per group. *p < 0.05; **p < 0.01; ***p < 0.005 versus WT.
FIGURE 3.
FIGURE 3.
Insulin-induced suppression of hepatic glucose output was impaired in L-iNOS-Tg mice. A hyperinsulinemic euglycemic clamp study revealed that hepatic glucose output during the clamp was significantly greater in iNOS-Tg mice than WT littermates (p < 0.05), although basal hepatic glucose output did not differ between the two groups (A). Insulin infusion remarkably suppressed hepatic glucose output in WT mice (p < 0.0005). In L-iNOS-Tg mice, however, hepatic glucose output during the clamp was not significantly decreased compared with the basal level (p > 0.10). During the clamp, there were no differences in plasma glucose levels (B), glucose infusion rates (C), and whole-body glucose uptake, glycolysis, and glycogen synthesis (D) between L-iNOS-Tg and WT mice. n = 7–8 per group. *, p < 0.05 versus WT during the clamp.
FIGURE 4.
FIGURE 4.
Liver-specific iNOS expression inhibited insulin-stimulated tyrosine phosphorylation of IRS-1 and IRS-2 in mouse liver. At 10 weeks of age, after overnight fasting, insulin (0.65 units/kg of body weight) or saline was injected via the portal vein, and 5 min later liver (A–E) and muscle (F) was taken under anesthesia. IR-mediated signaling was evaluated by immunoprecipitation (IP) with anti-IR, anti-IRS-1, or anti-phospho tyrosine (PY) antibody followed by immunoblotting (IB) with anti-PY or IRS-2 antibody (A). Insulin-stimulated tyrosine phosphorylation of IR was not altered in L-iNOS-Tg compared with WT littermates (B). In contrast, insulin-stimulated tyrosine phosphorylation of IRS-1 and IRS-2 was significantly decreased in L-iNOS-Tg mice relative to WT littermates (C and D). Insulin markedly increased tyrosine phosphorylation of IRS-1 and IRS-2 in WT mice. In L-iNOS-Tg mice, however, insulin did not significantly increase tyrosine phosphorylation of IRS-1 and IRS-2. The protein expression of IR, IRS-1, and IRS-2 expression was not affected by the iNOS transgene. Consistently, IRS-2-associated PI3K activity was increased by insulin injection in WT, but not L-iNOS-Tg, mice, as determined by in vitro phosphorylation of phosphatidylinositol to phosphatidylinositol 3-phosphate (PIP; E). In skeletal muscle, however, insulin-stimulated tyrosine phosphorylation of IRS-1 did not differ between the two groups (F). **, p < 0.01; ***, p < 0.005 versus WT with saline; ##, p < 0.01 versus Tg with saline. §, p < 0.05; §§, p < 0.02 versus Tg with insulin.
FIGURE 5.
FIGURE 5.
Insulin-stimulated phosphorylation of Akt was significantly impaired in liver, but not in skeletal muscle, of iNOS-Tg mice. At 10 weeks of age, insulin (0.65 units/kg of body weight) or saline was injected via the portal vein after overnight fasting (A). At 5 min after the injection, liver and skeletal muscle was taken under anesthesia. Insulin-stimulated phosphorylation of Akt at threonine 308 and serine 473 was significantly blunted in liver (B), but not in skeletal muscle (C), of iNOS-Tg mice as compared with WT littermates. Basal (exogenous insulin-naïve) Akt phosphorylation was slightly, but significantly increased in both liver and skeletal muscle of L-iNOS-Tg mice relative to WT mice. The protein expression of Akt did not differ between L-iNOS-Tg and WT littermates in liver and skeletal muscle. *, p < 0.05; **, p < 0.01; ***, p < 0.001 versus WT with saline; ##, p < 0.002 versus Tg with saline. §, p < 0.05, §§§, p < 0.0002 versus Tg with insulin.
FIGURE 6.
FIGURE 6.
Liver-specific iNOS expression blocked insulin-stimulated phosphorylation of GSK-3β, FoxO1, and mTOR in mouse liver. At 10 weeks of age insulin (0.65 units/kg of body weight) or saline was injected via the portal vein after overnight fasting. Phosphorylation was evaluated by immunoblot analysis (A). At 5 min after the injection, liver was taken under anesthesia. In WT mice insulin markedly increased phosphorylation of GSK-3β (B), FoxO1 (C), mTOR (D), p70S6K (E), and S6 (F) in liver. However, insulin failed to increase phosphorylation of these signaling molecules in iNOS-Tg mice. Liver-specific iNOS expression did not alter the protein expression of GSK-3β, FoxO1, mTOR, p70S6K, and S6. *, p < 0.05; **, p < 0.01; ***, p < 0.005 versus WT with saline. §, p < 0.05; §§, p < 0.01; §§§, p < 0.005 versus Tg with insulin.
FIGURE 7.
FIGURE 7.
Increased basal phosphorylation of IRS-1, IRS-2, and Akt in liver of L-iNOS-Tg mice. A modest but significant increase in basal (exogenous insulin-naïve, namely saline-injected) Akt phosphorylation in L-iNOS-Tg mice (Fig. 5) motivated us to further investigate basal phosphorylation status in L-iNOS-Tg mice in the immunoblots with long exposure (L) to the membranes (A). PY, phosphotyrosine. Insulin-stimulated phosphorylation was evaluated in the immunoblots with short exposure (S) as shown in Figs. 4–6. Immunoblot analysis with long exposure showed that basal (exogenous insulin-naïve, insulin −) tyrosine phosphorylation of IRS-1 and IRS-2 was significantly increased in L-iNOS-Tg mice relative to WT mice (B and C), although we did not find significant differences in the immunoblots with short exposure (Figs. 4, C and D). However, tyrosine phosphorylation of IR was undetectable both in L-iNOS-Tg and WT mice (A and supplemental Fig. 3). Consistent with the data in the immunoblots with short exposure shown in Fig. 5, basal phosphorylation of Akt at threonine 308 and serine 473 was increased in L-iNOS-Tg mice than WT littermates in the immunoblots with long exposure (E and F) as well. *, p < 0.05; **, p < 0.01 versus WT with saline (insulin −). S, short exposure; L, long exposure.
FIGURE 8.
FIGURE 8.
Effects of liver-specific iNOS expression on basal phosphorylation of downstream signaling molecules of the Akt pathway in mouse liver. Immunoblot analysis with long exposure (L) to the membranes revealed that basal (exogenous insulin-naïve, insulin −) phosphorylation of GSK-3β, mTOR, p70S6K, and S6 was significantly increased in L-iNOS-Tg mice compared with WT littermates, although no statistical difference was found in basal phosphorylation of these proteins in the immunoblots with short exposure (S) as shown in Fig. 6. No difference was found in basal phosphorylation of FoxO1 between the two groups even in the immunoblots with long exposure (C) as well as those with short exposure (Fig. 6C). *, p < 0.05; **, p < 0.01 versus WT with saline (insulin −). S, short exposure; L, long exposure., not significant.
FIGURE 9.
FIGURE 9.
Increased basal phosphorylation of IRS-1 and Akt in skeletal muscle of L-iNOS-Tg mice. Basal (exogenous insulin-naïve, insulin −) phosphorylation was evaluated by immunoblot analysis with long exposure to the membranes (A and C). Immunoblots with short exposure showed that there was no significant difference in insulin-stimulated phosphorylation of IRS-1 between L-iNOS-Tg and WT mice (Fig. 4F), although there was a trend of increased basal phosphorylation of IRS-1 in L-iNOS-Tg mice relative to WT mice. When the results were further analyzed in the immunoblots with longer exposure, we found a significantly increased basal phosphorylation of IRS-1 in skeletal muscle of L-iNOS-Tg mice (B). The protein expression of IRS-1 did not differ between the two groups. Similar to the results in the immunoblots with short exposure (Fig. 5C), immunoblot analysis with long exposure demonstrated that basal phosphorylation of Akt was significantly increased in skeletal muscle of L-iNOS-Tg mice compared with WT littermates (D and E), whereas no difference was found in insulin-stimulated Akt phosphorylation (Fig. 5C). n = 6 per group. *, p < 0.05; **, p < 0.01 versus WT with saline (insulin −).
FIGURE 10.
FIGURE 10.
Increased S-nitrosylation of Akt and upstream insulin signaling molecules in liver of L-iNOS-Tg mice. S-Nitrosylation was evaluated by biotin switch analysis (A). S-Nitrosylated Akt (SNO-Akt) was markedly increased in liver of L-iNOS-Tg mice relative to WT littermates at 15 weeks of age (B). Similarly, S-nitrosylation of IR, IRS-1, and IRS-2 was also increased in L-iNOS-Tg mice compared with WT littermates (C–E). The protein expression of Akt, IR, IRS-1, and IRS-2 did not differ between the two groups. **, p < 0.01; ***, p < 0.005 versus WT.
FIGURE 11.
FIGURE 11.
Increases in triglycerides levels, expression of lipogenic genes, and JNK activity in L-iNOS-Tg mice. Triglycerides content in liver (A) were significantly greater in L-iNOS-Tg mice than WT mice after 4-h and overnight (O/N) fasting at 15 weeks of age. Plasma triglycerides concentrations were significantly greater in L-iNOS-Tg mice than WT mice (B). Plasma non-esterified fatty acid (NEFA; C) and total cholesterol (D) concentrations, however, did not significantly differ between the two groups. Consistent with increased triglycerides levels, mRNA expression levels of SREBP-1c (E) and acetyl-CoA carboxylase (ACC; F) were significantly elevated in liver of L-iNOS-Tg mice compared with WT littermates after 4 h of fasting. Fatty acid synthase (FAS) mRNA levels appear to be increased in L-iNOS-Tg mice relative to WT mice, but there was no significant difference between the two groups (G). Lipid accumulation can increase JNK activity. As expected, phosphorylation of JNK was significantly increased in liver of L-iNOS-Tg mice relative to WT littermates (H). Phosphorylation of c-Jun and endogenous substrate of JNK appeared to be greater in L-iNOS-Tg mice, but there was no significant difference (I). n = 6 per group. *, p < 0.05; **, p < 0.005 versus WT; N.S., not significant.
FIGURE 12.
FIGURE 12.
Expression of gluconeogenic genes was not increased in liver of L-iNOS-Tg mice. mRNA levels of PEPCK (A), G-6-Pase (B), and PGC-1α (C) did not differ in liver between L-iNOS-Tg and WT littermates after 4-h and overnight (O/N) fasting. mRNA expression of PEPCK and PGC-1α increased after overnight fasting compared with 4 h of fasting both in L-iNOS-Tg and WT mice. †, p < 0.05; ††, p < 0.01 versus WT after 4 h of fasting; ¶, p < 0.05; ¶¶, p < 0.01 versus Tg after 4 h of fasting.
FIGURE 13.
FIGURE 13.
Effects of liver-specific iNOS expression on glycogen metabolism in liver. Glycogen content was significantly decreased in the liver of L-iNOS-Tg mice compared with WT mice after 4 h of fasting at 15 weeks of age (A). After overnight (O/N) fasting, hepatic glycogen content was remarkably decreased in both WT and L-iNOS-Tg mice, and no significant difference was found between the two groups. GP protein expression was significantly increased in L-iNOS-Tg mice relative to WT littermates after 4 h of fasting (B and C). After overnight fasting, however, GP expression was decreased both in L-iNOS-Tg and WT mice, and there was no significant difference between the two groups. Likewise, the activities of total GP and GP-a were greater in L-iNOS-Tg mice than WT littermates after 4 h of fasting (D). After overnight fasting, GP activities were decreased both in L-iNOS-Tg and WT mice, and there was no significant difference between the two groups. The ratio of total GP to GP-a activity did not differ between the two groups. GS protein expression was significantly increased in L-iNOS-Tg mice after 4-h, but not overnight fasting, as compared with WT mice (B and E). Inhibitory phosphorylation of GS was elevated in L-iNOS-Tg mice after 4-h, but not overnight fasting, relative to WT littermates (F). Consistent with increased inhibitory phosphorylation of GS, GS activity was significantly decreased in L-iNOS-Tg mice compared with WT littermates after 4 h of fasting (G). n = 6 per group. *, p < 0.05; **, p < 0.01 versus WT; N.S., not significant.
FIGURE 14.
FIGURE 14.
Impaired insulin signaling in primary hepatocytes isolated from L-iNOS-Tg mice. Insulin-stimulated phosphorylation of IR did not differ in primary hepatocytes between L-iNOS-Tg and WT littermates. In contrast, insulin-stimulated phosphorylation of IRS-1/2, Akt, p70S6K, and GSK-3β was significantly decreased in hepatocytes from L-iNOS-Tg mice compared with WT mice. The protein expression of these molecules and GAPDH was not altered by the iNOS transgene. n = 4 per group. **, p < 0.005 versus WT without insulin; #, p < 0.05; ##, p < 0.01 versus Tg without insulin. §, p < 0.05; §§, p < 0.01 versus Tg with insulin.
FIGURE 15.
FIGURE 15.
Effects of the iNOS transgene on basal phosphorylation of insulin signaling molecules in primary hepatocytes. Basal (insulin-unstimulated, insulin −) phosphorylation was evaluated by immunoblot analysis with long exposure (L) to the membranes (A). Immunoblots with short exposure (S) showed that there was no significant difference in insulin-stimulated phosphorylation of IRS-1/2. Akt, p70S6K, and GSK-3β between L-iNOS-Tg and WT mice is shown in Fig. 14. When the results were further analyzed in the immunoblots with longer exposure, we found a significantly increased basal phosphorylation of Akt at threonine 308 and p70S6K in primary hepatocytes from L-iNOS-Tg mice (C and E). Basal phosphorylation of IRS-1/2, Akt at serine 473, and GSK-3β appeared to be increased by the iNOS transgene, but there were no significant differences (B, D, and F). n = 4 per group. *, p < 0.05, versus WT without insulin; N.S., not significant.
FIGURE 16.
FIGURE 16.
Effects of rapamycin on impaired insulin signaling in primary hepatocytes from L-iNOS-Tg mice. Treatment with rapamycin (1 μm) for 19 h did not block the decreased insulin-stimulated phosphorylation of IRS-1/2, Akt, and GSK-3β in primary hepatocytes from L-iNOS-Tg mice relative to those from WT littermates (A). Rapamycin treatment effectively suppressed phosphorylation of p70S6K and S6 even in the presence of insulin (10 nm) and 10% FBS (Serum) in primary hepatocytes from both L-iNOS-Tg and WT mice (B).

Similar articles

Cited by

References

    1. Kaneki M., Shimizu N., Yamada D., Chang K. (2007) Antioxid. Redox. Signal 9, 319–329 - PubMed
    1. Martyn J. A., Kaneki M., Yasuhara S. (2008) Anesthesiology 109, 137–148 - PMC - PubMed
    1. Kim J. K., Kim Y. J., Fillmore J. J., Chen Y., Moore I., Lee J., Yuan M., Li Z. W., Karin M., Perret P., Shoelson S. E., Shulman G. I. (2001) J. Clin. Invest. 108, 437–446 - PMC - PubMed
    1. Arkan M. C., Hevener A. L., Greten F. R., Maeda S., Li Z. W., Long J. M., Wynshaw-Boris A., Poli G., Olefsky J., Karin M. (2005) Nat. Med. 11, 191–198 - PubMed
    1. Hirosumi J., Tuncman G., Chang L., Görgün C. Z., Uysal K. T., Maeda K., Karin M., Hotamisligil G. S. (2002) Nature 420, 333–336 - PubMed

Publication types